Welcome to OmniXAI’s documentation!
Introduction
OmniXAI (short for Omni eXplainable AI) is a Python library for explainable AI (XAI), offering omni-way explainable AI and interpretable machine learning capabilities to address many pain points in explaining decisions made by machine learning models in practice. OmniXAI aims to be a one-stop comprehensive library that makes explainable AI easy for data scientists, ML researchers and practitioners who need explanation for various types of data, models and explanation methods at different stages of ML process:
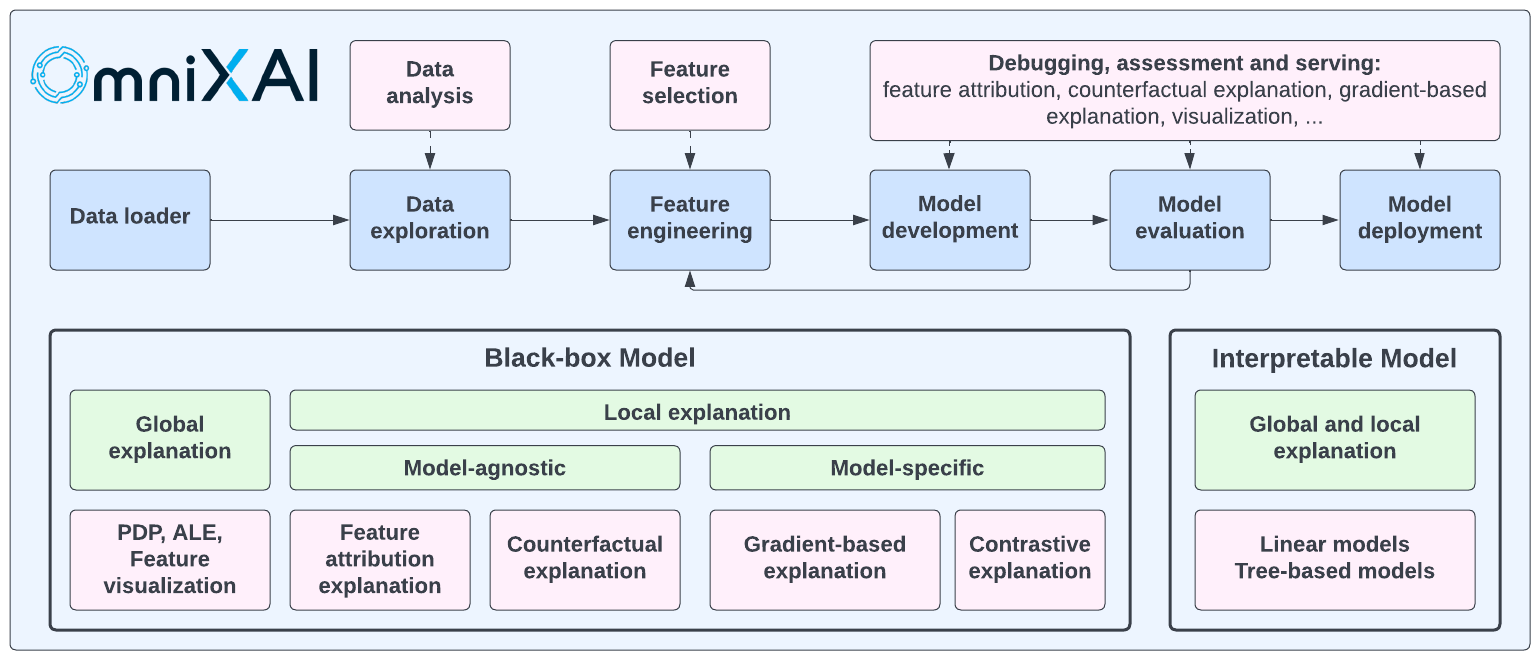
OmniXAI includes a rich family of explanation methods integrated in a unified interface, which supports multiple data types (tabular data, images, texts, time-series), multiple types of ML models (traditional ML in Scikit-learn and deep learning models in PyTorch/TensorFlow), and a range of diverse explaination methods including “model-specific” and “model-agnostic” methods (such as feature-attribution explanation, counterfactual explanation, gradient-based explanation, etc). For practitioners, OmniXAI provides an easy-to-use unified interface to generate the explanations for their applications by only writing a few lines of codes, and also a GUI dashboard for visualization for obtaining more insights about decisions. Compared with other existing explanation libraries (such as IBM’s AIX360, Microsoft’s InterpretML, Alibi and explainX), our library has a comprehensive list of XAI capabilities and unique features including the followings:
Data analysis/exploration: Analyzing feature correlations, checking imbalance issues.
Support most popular explanation methods: Analyzing different aspects of a ML model by various explanation methods.
Support counterfactual explanation: Providing the information about how to change the current prediction.
Support gradient-based explanation: Supporting integrated-gradient, Grad-CAM and its variants.
Support image, text and timeseries data: Providing various explanations for image, text and timeseries models.
A much simpler interface: Generating diverse explanations by writing a few lines of code only.
A GUI dashboard: Providing an GUI dashboard for users to examine and compare the generated explanations.
Easy to extend: Adding new explanation algorithms easily by implementing a single class derived from the explainer base class.
Capabilities and Features
The following table shows the supported explanation methods and features in our library. We will continue improving this library to make it more comprehensive in the future, e.g., supporting more explanation methods for vision, NLP and time series tasks.
Method |
Model Type |
Explanation Type |
EDA |
Tabular |
Image |
Text |
Timeseries |
|---|---|---|---|---|---|---|---|
Feature analysis |
NA |
Global |
✓ |
||||
Feature selection |
NA |
Global |
✓ |
||||
Prediction metrics |
Black box |
Global |
✓ |
✓ |
✓ |
✓ |
|
Bias metrics |
Black box |
Global |
✓ |
||||
PDP |
Black box |
Global |
✓ |
||||
ALE |
Black box |
Global |
✓ |
||||
Sensitivity analysis |
Black box |
Global |
✓ |
||||
Feature visualization |
Torch or TF |
Global |
✓ |
||||
LIME |
Black box |
Local |
✓ |
✓ |
✓ |
||
SHAP |
Black box* |
Local |
✓ |
✓ |
✓ |
✓ |
|
What-if |
Black box |
Local |
✓ |
||||
Integrated gradient |
Torch or TF |
Local |
✓ |
✓ |
✓ |
||
Counterfactual |
Black box* |
Local |
✓ |
✓ |
✓ |
✓ |
|
Contrastive explanation |
Torch or TF |
Local |
✓ |
||||
Grad-CAM, Grad-CAM++ |
Torch or TF |
Local |
✓ |
||||
Score-CAM |
Torch or TF |
Local |
✓ |
||||
Layer-CAM |
Torch or TF |
Local |
✓ |
||||
Smooth gradient |
Torch or TF |
Local |
✓ |
||||
Guided backpropagation |
Torch or TF |
Local |
✓ |
||||
Learning to explain |
Black box |
Local |
✓ |
✓ |
✓ |
||
Linear models |
Linear models |
Global and Local |
✓ |
||||
Tree models |
Tree models |
Global and Local |
✓ |
||||
Feature maps |
Torch or TF |
Local |
✓ |
SHAP accepts black box models for tabular data, PyTorch/Tensorflow models for image data, transformer models for text data. Counterfactual accepts black box models for tabular, text and time series data, and PyTorch/Tensorflow models for image data.
Comparison with Competitors
The following table shows the comparison between our toolkit/library and other existing XAI toolkits/libraries in literature:
Data Type |
Method |
OmniXAI |
InterpretML |
AIX360 |
Eli5 |
Captum |
Alibi |
explainX |
|---|---|---|---|---|---|---|---|---|
Tabular |
LIME |
✓ |
✓ |
✓ |
✘ |
✓ |
✘ |
✘ |
SHAP |
✓ |
✓ |
✓ |
✘ |
✓ |
✓ |
✓ |
|
PDP |
✓ |
✓ |
✘ |
✘ |
✘ |
✘ |
✘ |
|
ALE |
✓ |
✘ |
✘ |
✘ |
✘ |
✓ |
✘ |
|
Sensitivity |
✓ |
✓ |
✘ |
✘ |
✘ |
✘ |
✘ |
|
Integrated gradient |
✓ |
✘ |
✘ |
✘ |
✓ |
✓ |
✘ |
|
Counterfactual |
✓ |
✘ |
✘ |
✘ |
✘ |
✓ |
✘ |
|
Linear models |
✓ |
✓ |
✓ |
✓ |
✘ |
✓ |
✓ |
|
Tree models |
✓ |
✓ |
✓ |
✓ |
✘ |
✓ |
✓ |
|
L2X |
✓ |
✘ |
✘ |
✘ |
✘ |
✘ |
✘ |
|
Image |
LIME |
✓ |
✘ |
✘ |
✘ |
✓ |
✘ |
✘ |
SHAP |
✓ |
✘ |
✘ |
✘ |
✓ |
✘ |
✘ |
|
Integrated gradient |
✓ |
✘ |
✘ |
✘ |
✓ |
✓ |
✘ |
|
Grad-CAM, Grad-CAM++ |
✓ |
✘ |
✘ |
✓ |
✓ |
✘ |
✘ |
|
Contrastive |
✓ |
✘ |
✓ |
✘ |
✘ |
✓ |
✘ |
|
Counterfactual |
✓ |
✘ |
✘ |
✘ |
✘ |
✓ |
✘ |
|
L2X |
✓ |
✘ |
✘ |
✘ |
✘ |
✘ |
✘ |
|
Feature visualization |
✓ |
✘ |
✘ |
✘ |
✘ |
✘ |
✘ |
|
Text |
LIME |
✓ |
✘ |
✘ |
✓ |
✓ |
✘ |
✘ |
SHAP |
✓ |
✘ |
✘ |
✘ |
✓ |
✘ |
✘ |
|
Integrated gradient |
✓ |
✘ |
✘ |
✘ |
✓ |
✓ |
✘ |
|
L2X |
✓ |
✘ |
✘ |
✘ |
✘ |
✘ |
✘ |
|
Counterfactual |
✓ |
✘ |
✘ |
✘ |
✘ |
✘ |
✘ |
|
Timeseries |
SHAP |
✓ |
✘ |
✘ |
✘ |
✘ |
✘ |
✘ |
Counterfactual |
✓ |
✘ |
✘ |
✘ |
✘ |
✘ |
✘ |
Installation
You can install omnixai from PyPI by calling pip install omnixai. You may install from source by
cloning the OmniXAI repo, navigating to the root directory, and calling
pip install ., or pip install -e . to install in editable mode. You may install additional dependencies:
For vision tasks: Calling
pip install omnixai[vision], orpip install .[vision]from the root directory of the repo.For NLP tasks: Calling
pip install omnixai[nlp], orpip install .[nlp]from the root directory of the repo.For plotting & visualization: Calling
pip install omnixai[plot], orpip install .[plot]from the root directory of the repo.
Getting Started
To get started, we recommend the linked tutorials in Tutorials & Example Code.
In general, we recommend using omnixai.explainers.tabular.TabularExplainer, omnixai.explainers.vision.VisionExplainer,
omnixai.explainers.nlp.NLPExplainer and omnixai.explainers.timeseries.TimeseriesExplainer for tabular, vision, NLP and
time series tasks, respectively, and using omnixai.explainers.data.DataAnalyzer and omnixai.explainers.prediction.PredictionAnalyzer
for feature analysis and prediction result analysis. To generate explanations, one only needs to specify
The ML model to explain: e.g., a scikit-learn model, a tensorflow model, a pytorch model or a black-box prediction function.
The pre-processing function: i.e., converting raw data into the model inputs.
The post-processing function (optional): e.g., converting the model outputs into class probabilities.
The explainers to apply: e.g., SHAP, MACE, Grad-CAM.
Let’s take the income prediction task as an example. The dataset used in this example is for income prediction (https://archive.ics.uci.edu/ml/datasets/adult). We recommend using data class Tabular to represent a tabular dataset. To create a Tabular instance given a pandas dataframe, one needs to specify the dataframe, the categorical feature names (if exists) and the target/label column name (if exists).
from omnixai.data.tabular import Tabular
# Load the dataset
feature_names = [
    "Age", "Workclass", "fnlwgt", "Education",
    "Education-Num", "Marital Status", "Occupation",
    "Relationship", "Race", "Sex", "Capital Gain",
    "Capital Loss", "Hours per week", "Country", "label"
]
df = pd.DataFrame(
   np.genfromtxt('adult.data', delimiter=', ', dtype=str),
   columns=feature_names
)
tabular_data = Tabular(
    df,
    categorical_columns=[feature_names[i] for i in [1, 3, 5, 6, 7, 8, 9, 13]],
    target_column='label'
)
The package omnixai.preprocessing provides several useful preprocessing functions
for a Tabular instance. TabularTransform is a special transform designed for processing tabular data.
By default, it converts categorical features into one-hot encoding, and keeps continuous-valued features.
The method transform of TabularTransform transforms a Tabular instance to a numpy array.
If the Tabular instance has a target/label column, the last column of the numpy array
will be the target/label. After data preprocessing, we can train a XGBoost classifier for this task.
from omnixai.preprocessing.tabular import TabularTransform
# Data preprocessing
transformer = TabularTransform().fit(tabular_data)
class_names = transformer.class_names
x = transformer.transform(tabular_data)
# Split into training and test datasets
train, test, train_labels, test_labels = \
    sklearn.model_selection.train_test_split(x[:, :-1], x[:, -1], train_size=0.80)
# Train an XGBoost model (the last column of `x` is the label column after transformation)
model = xgboost.XGBClassifier(n_estimators=300, max_depth=5)
model.fit(train, train_labels)
# Convert the transformed data back to Tabular instances
train_data = transformer.invert(train)
test_data = transformer.invert(test)
To initialize TabularExplainer, we need to set the following parameters:
explainers: The names of the explainers to apply, e.g., [“lime”, “shap”, “mace”, “pdp”].data: The data used to initialize explainers.datais the training dataset for training the machine learning model. If the training dataset is too large,datacan be a subset of it by applyingomnixai.sampler.tabular.Sampler.subsample.model: The ML model to explain, e.g., a scikit-learn model, a tensorflow model or a pytorch model.preprocess: The preprocessing function converting the raw data into the inputs ofmodel.postprocess(optional): The postprocessing function transforming the outputs ofmodelto a user-specific form, e.g., the predicted probability for each class. The output ofpostprocessshould be a numpy array.mode: The task type, e.g., “classification” or “regression”.
The preprocessing function takes a Tabular instance as its input and outputs the processed features that
the ML model consumes. In this example, we simply call transformer.transform. If one uses some customized transforms
on pandas dataframes, the preprocess function has format: lambda z: some_transform(z.to_pd()). If the output of model
is not a numpy array, postprocess needs to be set to convert it into a numpy array.
from omnixai.explainers.tabular import TabularExplainer
from omnixai.visualization.dashboard import Dashboard

# Initialize a TabularExplainer
explainer = TabularExplainer(
   explainers=["lime", "shap", "mace", "pdp", "ale"], # The explainers to apply
   mode="classification",                             # The task type
   data=train_data,                                   # The data for initializing the explainers
   model=model,                                       # The ML model to explain
   preprocess=lambda z: transformer.transform(z),     # Converts raw features into the model inputs
   params={
      "mace": {"ignored_features": ["Sex", "Race", "Relationship", "Capital Loss"]}
   }                                                  # Additional parameters
)
In this example, LIME, SHAP and MACE generate local explanations while PDP (partial dependence plot)
generates global explanations. explainer.explain returns the local explanations generated by the
three methods given the test instances, and explainer.explain_global returns the global explanations
generated by PDP. TabularExplainer hides all the details behind the explainers, so we can simply call
these two methods to generate explanations.
# Generate explanations
test_instances = tabular_data[:5]
local_explanations = explainer.explain(X=test_instances)
global_explanations = explainer.explain_global(
    params={"pdp": {"features": ["Age", "Education-Num", "Capital Gain",
                                 "Capital Loss", "Hours per week", "Education",
                                 "Marital Status", "Occupation"]}}
)
Similarly, we create a PredictionAnalyzer for computing performance metrics for this classification task. To initialize PredictionAnalyzer, we set the following parameters:
mode: The task type, e.g., “classification” or “regression”.test_data: The test dataset, which should be a Tabular instance.test_targets: The test labels or targets. For classification,test_targetsshould be integers (processed by a LabelEncoder) and match the class probabilities returned by the ML model.preprocess: The preprocessing function converting the raw data (a Tabular instance) into the inputs ofmodel.postprocess(optional): The postprocessing function transforming the outputs ofmodelto a user-specific form, e.g., the predicted probability for each class. The output ofpostprocessshould be a numpy array.
from omnixai.explainers.prediction import PredictionAnalyzer

analyzer = PredictionAnalyzer(
    mode="classification",
    test_data=test_data,                           # The test dataset (a `Tabular` instance)
    test_targets=test_labels,                      # The test labels (a numpy array)
    model=model,                                   # The ML model
    preprocess=lambda z: transformer.transform(z)  # Converts raw features into the model inputs
)
prediction_explanations = analyzer.explain()
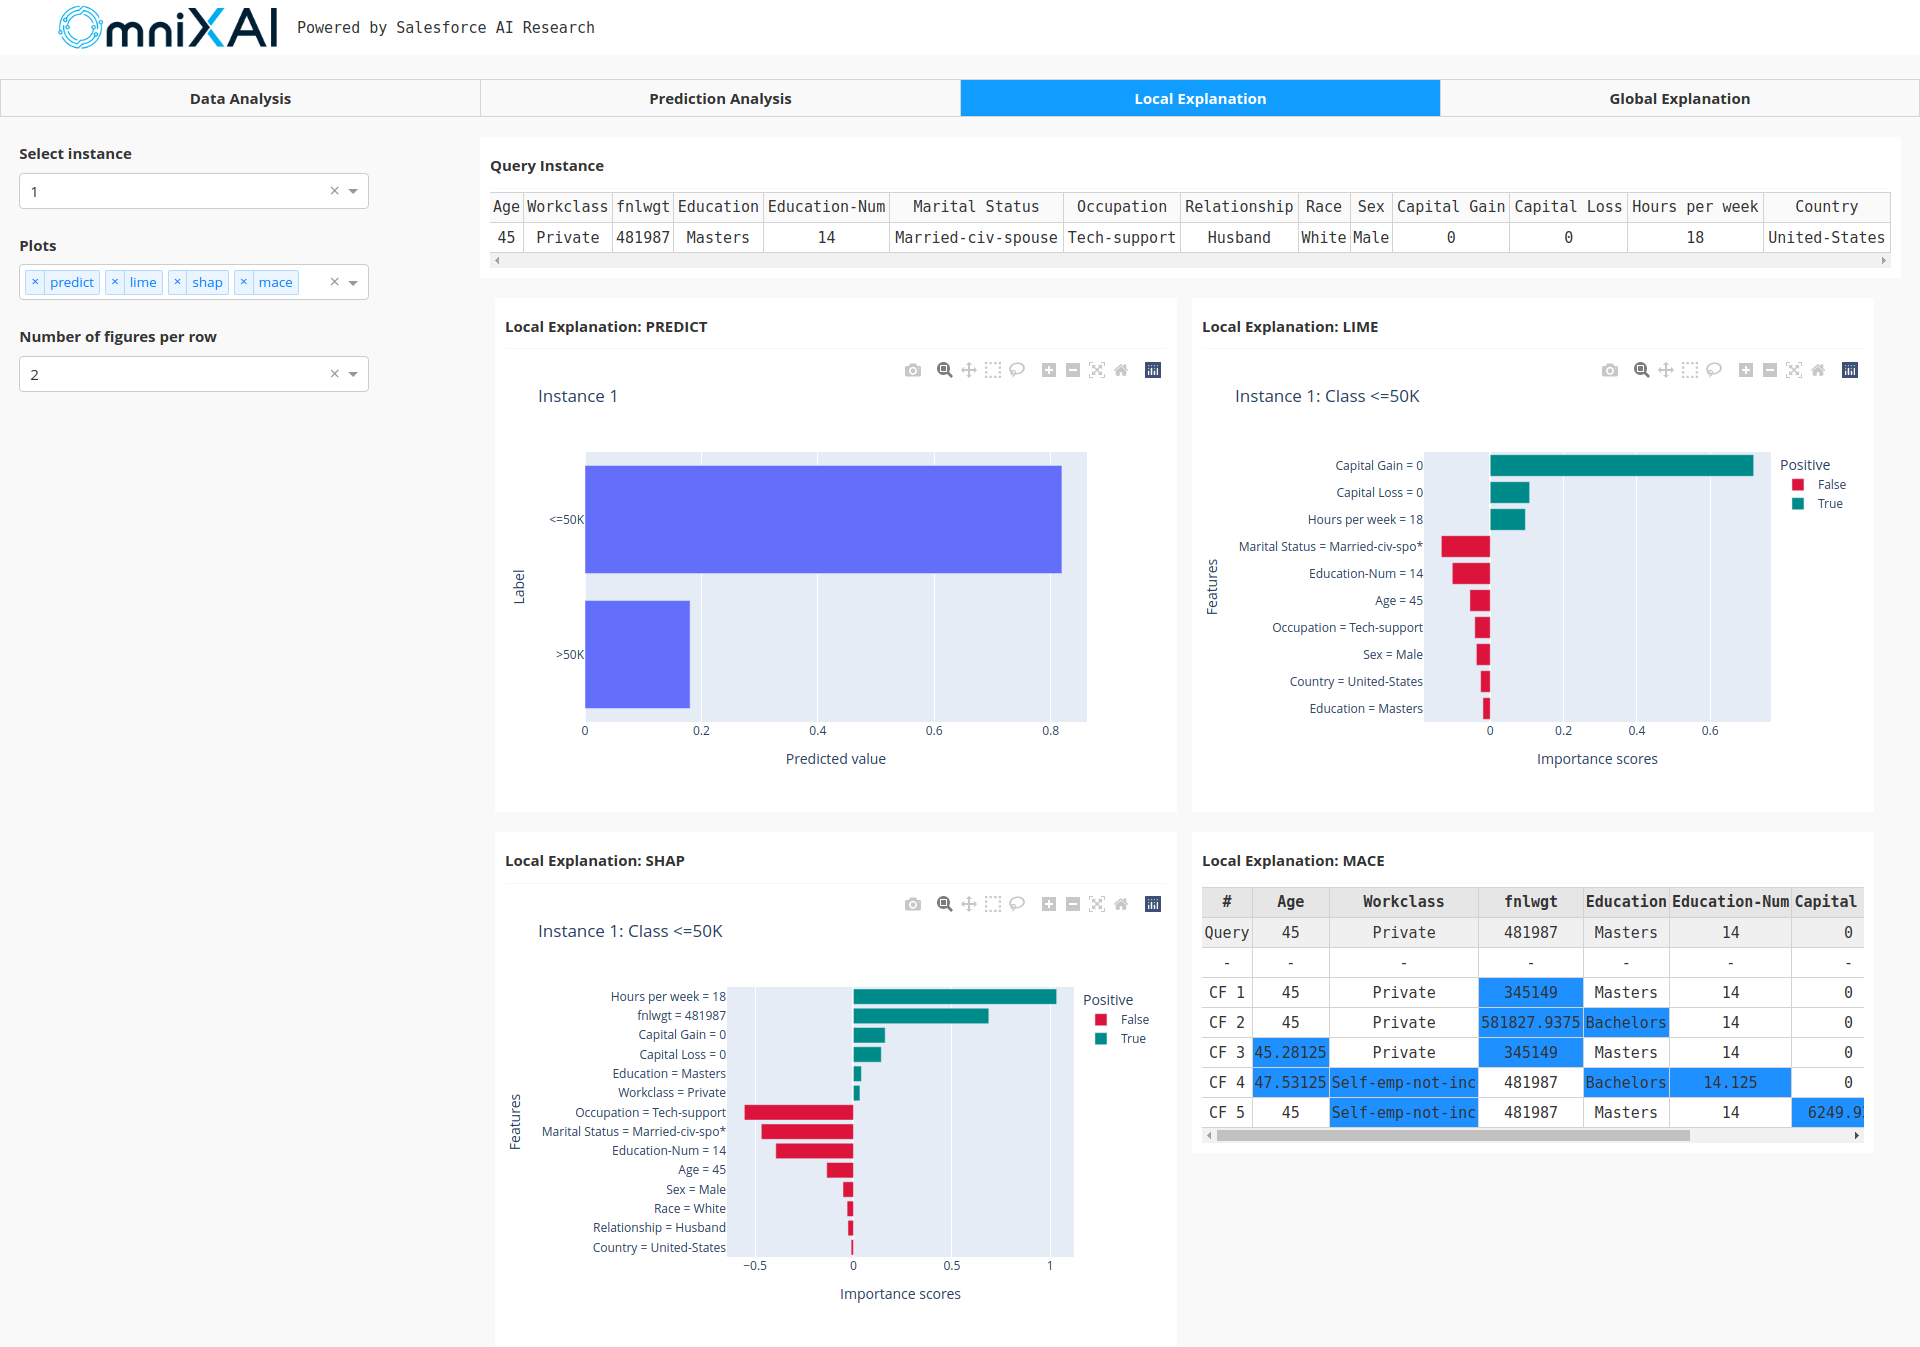
Given the generated explanations, we can launch a dashboard (a Dash app) for visualization by setting the test
instance, the local explanations, the global explanations, the prediction metrics, the class names, and additional
parameters for visualization (optional). If you want “what-if” analysis, you can set the explainer parameter
when initializing the dashboard. For “what-if” analysis, OmniXAI also allows you to set a second explainer
if you want to compare different models.
# Launch a dashboard for visualization
dashboard = Dashboard(
    instances=test_instances,                        # The instances to explain
    local_explanations=local_explanations,           # Set the generated local explanations
    global_explanations=global_explanations,         # Set the generated global explanations
    prediction_explanations=prediction_explanations, # Set the prediction metrics
    class_names=class_names,                         # Set class names
    explainer=explainer                              # The created TabularExplainer for what if analysis
)
dashboard.show()                                     # Launch the dashboard
After opening the Dash app in the browser, we will see a dashboard showing the explanations:
How to Contribute
Thank you for your interest in contributing to the library!
Before you get started, clone this repo, run pip install pre-commit, and run pre-commit install from the root
directory of the repo. This will ensure all files are formatted correctly and contain the appropriate
license headers whenever you make a commit. To add a new explanation method into the library,
one may follow the steps below:
Choose the task type of the new explainer, e.g., “tabular”, “vision”, “nlp” or “timeseries”.
Choose the explainer type, e.g., “model-agnostic”, “model-specific” or “counterfactual”.
Create a new python script file for this explainer in the specified folder, e.g., it is put under the folder “explainers/tabular/agnostic” if it is a model-agnostic explainer for tabular data.
Create the explainer class that inherits from
omnixai.explainers.base.ExplainerBase. The constructor for the new explainer class has two options:__init__(self, predict_function, mode, **kwargs): This is for model-agnostic explainers.
predict_functionis the prediction function of the black-box ML model to explain. The inputs ofpredict_functionare the raw input features, and the outputs ofpredict_functionare the model outputs.modeis the task type, e.g., “classification”, “regression”.__init__(self, model, preprocess_function, postprocess_function, mode, **kwargs): This is for model-specific explainers.
modelis the ML model to explain. The model-specific explainers require some information aboutmodel, e.g., whethermodelis differentiable (PyTorch or Tensorflow).preprocess_functionis the pre-processing function formodel, converting the raw features into the inputs ofmodel, e.g., resizing images to (224, 224) and normalizing pixel values.postprocess_functionis the post-processing function formodel, which is used to convert the output logits into class probabilities.postprocess_functionis optional.modeis the task type, e.g., “classification”, “regression”.
Add a class attribute
explanation_type(string) with value “local”, “global” or “both”, indicating whether the method can generate local explanations, global explanations or both.Add a class attribute
alias(list) specifying the explainer names.Implement the “explain” function, e.g.,
explain(self, **kwargs)for local explanations, orexplain_global(self, X, **kwargs)for global explanations where the type ofXis class Tabular, Image, Text or Timeseries.Import the explainer class in “__init__.py” of the packages
omnixai.explainers.tabular,omnixai.explainers.vision,omnixai.explainers.nlporomnixai.explainers.timeseries.
The new explainer will be registered automatically, which can be called via omnixai.explainers.tabular.TabularExplainer,
omnixai.explainers.vision.VisionExplainer, omnixai.explainers.nlp.NLPExplainer or omnixai.explainers.timeseries.TimeseriesExplainer
by specifying one of the names defined in alias.
Contents:
- OmniXAI: An Explanation Toolbox
- Introduction
- Library Design
- Installation
- Getting Started
- More Examples
- How to Contribute
- Modules for Different Data Types
- Preprocessing Functions
- omnixai.preprocessing package
- omnixai.preprocessing.base module
- omnixai.preprocessing.encode module
- omnixai.preprocessing.normalize module
- omnixai.preprocessing.fill module
- omnixai.preprocessing.pipeline module
- omnixai.preprocessing.tabular module
- omnixai.preprocessing.image module
- omnixai.preprocessing.text module
- omnixai.sampler.tabular module
- omnixai.preprocessing package
- Supported Explanation Methods
- Modules for Explanation Results
- Dashboard for Visualization
- Explainer Deployment
- Tutorials & Example Code
- Basics
- Applications
- DataAnalyzer for feature analysis
- TabularExplainer for income prediction (classification)
- TabularExplainer for house-price prediction (regression)
- VisionExplainer for image classification
- NLPExplainer for sentiment analysis
- NLPExplainer on IMDB dataset
- TimeseriesExplainer for time series anomaly detection
- OmniXAI in a ML workflow
- Tabular Explainers
- Accumulated local effects (ALE)
- Counterfactual explanation on Diabetes dataset
- GPT explainer for income prediction
- L2X (learning to explain) for income prediction
- LIME for income prediction
- Logistic regression for income prediction
- MACE counterfactual explanation for income prediction
- Paritial dependence plots (PDP)
- Learning to Rank Expanations Demo
- Morris sensitivity analysis
- SHAP for income prediction
- Decision tree for income prediction
- Vision Explainers
- Counterfactual explanation on ImageNet
- Counterfactual explanation on MNIST (Tensorflow)
- Counterfactual explanation on MNIST (PyTorch)
- Contrastive explanation on MNIST (Tensorflow)
- Contrastive explanation on MNIST (PyTorch)
- Feature map visualization (Tensorflow)
- Feature map visualization (PyTorch)
- Feature visualization (Tensorflow)
- Feature visualization (PyTorch)
- Grad-CAM for image classification (Tensorflow)
- Grad-CAM for image classification (PyTorch)
- Grad-CAM for visual language tasks
- Integrated-gradient for image classification (Tensorflow)
- Integrated-gradient for image classification (PyTorch)
- Integrated-gradient for visual language tasks
- L2X (learning to explain) on MNIST
- LIME for image classification
- SHAP on MNIST
- NLP Explainers
- Counterfactual explanation for text classification
- Counterfactual explanation for question answering
- Integrated-gradient on IMDB dataset (Tensorflow)
- Integrated-gradient on IMDB dataset (PyTorch)
- L2X (learning to explain) for text classification
- LIME for text classification
- SHAP for sentiment analysis
- Timeseries Explainers