Logistic regression for income prediction
The library contains several special classes for linear models, e.g., LogisticRegression for classification tasks and LinearRegression for regression tasks. These classes provide a special method explain for generating both global explanations (linear coefficients) and local explanations (feature importance scores). One may apply these classes directly if using a linear model.
[1]:
# This default renderer is used for sphinx docs only. Please delete this cell in IPython.
import plotly.io as pio
pio.renderers.default = "png"
[2]:
import os
import unittest
import pprint
import sklearn
import sklearn.datasets
import sklearn.ensemble

import numpy as np
import pandas as pd
from omnixai.data.tabular import Tabular
from omnixai.explainers.tabular import LogisticRegression
The dataset used in this example is for income prediction (https://archive.ics.uci.edu/ml/datasets/adult). For linear models, we use Tabular to represent a tabular dataset, which can be constructed from a pandas dataframe or a numpy array. To create a Tabular instance given a numpy array, one needs to specify the data, the feature names, the categorical feature names (if exists) and the target/label column name (if exists).
[3]:
feature_names = [
    "Age", "Workclass", "fnlwgt", "Education",
    "Education-Num", "Marital Status", "Occupation",
    "Relationship", "Race", "Sex", "Capital Gain",
    "Capital Loss", "Hours per week", "Country", "label"
]
data = np.genfromtxt(os.path.join('../data', 'adult.data'), delimiter=', ', dtype=str)
tabular_data = Tabular(
    data,
    feature_columns=feature_names,
    categorical_columns=[feature_names[i] for i in [1, 3, 5, 6, 7, 8, 9, 13]],
    target_column='label'
)
To train the linear model, the method fit is called with the training dataset (a Tabular instance).
[4]:
np.random.seed(1)
model = LogisticRegression()
model.fit(tabular_data)
Validation accuracy: 0.8518347919545525
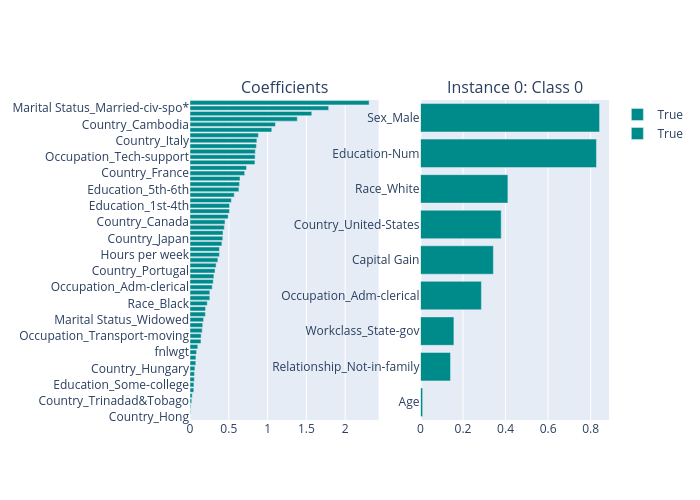
The linear model has both global explanations and local explanations generated by calling the method explain.
[5]:
test_x = tabular_data[0:5]
explanations = model.explain(test_x)
explanations.ipython_plot(index=0)