Examples of data objects
The library supports three data types Tabular, Image and Text defined in the modules omnixai.data.tabular, omnixai.data.image and omnixai.data.text, respectively. All the supported explainers take one of these data objects as their inputs when generating explanations, e.g., an explainer vision tasks takes an Image object as its input. These data objects can be constructed easily from pandas dataframes, numpy arrays, Pillow images or strings. This notebook will show
how to use these data objects.
Tabular data
Suppose we have a pandas dataframe representing a tabular dataset with both categorical and continuous-valued features:
[1]:
import pandas as pd

df = pd.DataFrame(
    data=[[1, 2, 3, 'male'], [4, 5, 6, 'female']],
    columns=['a', 'b', 'c', 'd']
)
The first three columns are continuous-valued features and the last column is the categorical feature. Given this dataframe, we can easily construct a Tabular instance by specifying the dataframe and the categorical columns:
[2]:
from omnixai.data.tabular import Tabular

x = Tabular(
    data=df,
    categorical_columns=['d']
)
print(x)
   a  b  c       d
0  1  2  3    male
1  4  5  6  female
If we want to construct a Tabular instance with a numpy array, we need to set the feature columns:
[3]:
x = Tabular(
    data=df.values,
    feature_columns=['a', 'b', 'c', 'd'],
    categorical_columns=['d']
)
print(x)
   a  b  c       d
0  1  2  3    male
1  4  5  6  female
Tabular has several useful methods:
[4]:
# Get the data shape
print(f"Shape: {x.shape}")
# Get the raw data values
print(f"Raw values:\n {x.values}")
# Get the categorical feature columns
print(f"Categorical features: {x.categorical_columns}")
# Get the continuous-valued feature columns
print(f"Continuous-valued features: {x.continuous_columns}")
# Get all the feature columns
print(f"All feature columns: {x.feature_columns}")
Shape: (2, 4)
Raw values:
 [[1 2 3 'male']
 [4 5 6 'female']]
Categorical features: ['d']
Continuous-valued features: ['a', 'b', 'c']
All feature columns: ['a', 'b', 'c', 'd']
A Tabular instance can be converted into a pandas dataframe or a numpy array:
[5]:
print(x.to_pd())
print(x.to_numpy())
   a  b  c       d
0  1  2  3    male
1  4  5  6  female
[[1 2 3 'male']
 [4 5 6 'female']]
The dataset represented by Tabular may have a target/label column, e.g., class labels in classification tasks. In the following example, the last column is the target/label column.
[6]:
df = pd.DataFrame(
    data=[[1, 2, 3, 'male', 'yes'], [4, 5, 6, 'female', 'no']],
    columns=['a', 'b', 'c', 'd', 'label']
)
To construct a Tabular instance, besides setting categorical feature columns, we also need to set the target/label column:
[7]:
x = Tabular(
    data=df,
    categorical_columns=['d'],
    target_column='label'
)
print(x)
print(f"Target column: {x.target_column}")
   a  b  c       d label
0  1  2  3    male   yes
1  4  5  6  female    no
Target column: label
To get a subset of the rows of x:
[8]:
print("The first row:")
print(x[0])
print("The second row:")
print(x[1])
print("Swap the two rows:")
print(x[[1, 0]])
The first row:
   a  b  c     d label
0  1  2  3  male   yes
The second row:
   a  b  c       d label
1  4  5  6  female    no
Swap the two rows:
   a  b  c       d label
1  4  5  6  female    no
0  1  2  3    male   yes
Image data
An Image object can be constructed from a numpy array (a batch of images) or a Pillow image. For example, a numpy array contains a batch of MNIST digit images:
[9]:
import torchvision

test_data = torchvision.datasets.MNIST(root='../data', train=False, download=True)
imgs = test_data.data.numpy()
print(imgs.shape)
(10000, 28, 28)
An Image object can be created as follows:
[10]:
from omnixai.data.image import Image

# `batched = True` means `data` contains a batch of images with
# shape `(batch_size, height, width)` or `(batch_size, height, width, channel)`.
images = Image(data=imgs, batched=True)
Here are some useful functions:
[11]:
print(f"Data shape: {images.shape}")
print(f"Image shape: {images.image_shape}")

print(f"The first image (Pillow):")
display(images[0].to_pil())
print(f"The second image (Pillow):")
display(images[1].to_pil())

print("Loop:")
for im in images[:5]:
    print(im.shape)
Data shape: (10000, 28, 28, 1)
Image shape: (28, 28, 1)
The first image (Pillow):

The second image (Pillow):

Loop:
(1, 28, 28, 1)
(1, 28, 28, 1)
(1, 28, 28, 1)
(1, 28, 28, 1)
(1, 28, 28, 1)
We can also convert Image into a numpy array:
[12]:
print(f"Numpy array shape: {images.to_numpy().shape}")
print(f"Numpy array shape: {images.to_numpy(keepdim=True).shape}")
print(f"Numpy array shape: {images.to_numpy(hwc=False, keepdim=True).shape}")
Numpy array shape: (10000, 28, 28)
Numpy array shape: (10000, 28, 28, 1)
Numpy array shape: (10000, 1, 28, 28)
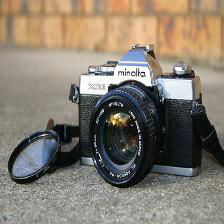
A color image example:
[13]:
from PIL import Image as PilImage

img = Image(PilImage.open('../data/images/camera.jpg').convert('RGB'))
print(f"Data shape: {img.shape}")
print(f"Image shape: {img.image_shape}")
print(f"The image (Pillow):")
# `to_pil` returns a single Pillow image if `batch_size = 1` or a list of Pillow images if `batch_size > 1`.
display(img.to_pil())
Data shape: (1, 224, 224, 3)
Image shape: (224, 224, 3)
The image (Pillow):
[14]:
print(f"Numpy array shape: {img.to_numpy().shape}")
print(f"Numpy array shape: {img.to_numpy(keepdim=True).shape}")
print(f"Numpy array shape: {img.to_numpy(hwc=False, keepdim=True).shape}")
Numpy array shape: (1, 224, 224, 3)
Numpy array shape: (1, 224, 224, 3)
Numpy array shape: (1, 3, 224, 224)
Text data
A Text object represents a batch of texts or sentences stored in a list. For example,
[15]:
from omnixai.data.text import Text

x = Text([
    "What a great movie! if you have no taste.",
    "it was a fantastic performance!",
    "best film ever",
    "such a great show!",
    "it was a horrible movie",
    "i've never watched something as bad"
])
Here are some useful functions:
[16]:
print(f"Number of sentences: {len(x)}")
print(f"The first sentence: {x[0]}")
print(f"Raw strings: {x.values}")
Number of sentences: 6
The first sentence: ['What a great movie! if you have no taste.']
Raw strings: ['What a great movie! if you have no taste.', 'it was a fantastic performance!', 'best film ever', 'such a great show!', 'it was a horrible movie', "i've never watched something as bad"]
Convert texts/sentences into a list of tokens:
[17]:
print(x.to_tokens())
[['what', 'a', 'great', 'movie', '!', 'if', 'you', 'have', 'no', 'taste', '.'], ['it', 'was', 'a', 'fantastic', 'performance', '!'], ['best', 'film', 'ever'], ['such', 'a', 'great', 'show', '!'], ['it', 'was', 'a', 'horrible', 'movie'], ['i', "'ve", 'never', 'watched', 'something', 'as', 'bad']]
Time series data
The Timeseries class represents a time series. The values of metrics/variables are stored in a numpy array with shape (timestamps, num_variables). We can construct a Timeseries instance from a pandas dataframe, where the index indicates the timestamps and the columns are the variables.
[18]:
from omnixai.data.timeseries import Timeseries
df = pd.DataFrame(
   [['2017-12-27', 1263.94091, 394.507, 16.530],
    ['2017-12-28', 1299.86398, 506.424, 14.162],
    ['2017-12-29', 1319.76541, 610.314, 15.173]],
   columns=['Date', 'Consumption', 'Wind', 'Solar']
)
df = df.set_index('Date')
df.index = pd.to_datetime(df.index)
[19]:
ts = Timeseries.from_pd(df)
print(ts)
            Consumption     Wind   Solar
2017-12-27   1263.94091  394.507  16.530
2017-12-28   1299.86398  506.424  14.162
2017-12-29   1319.76541  610.314  15.173
Here are some useful functions:
[20]:
print(f"Length of ts: {len(ts)}")
print(f"Length of ts: {ts.ts_len}")
print(f"Metrics: {ts.columns}")
print(f"Time-series shape: {ts.shape}")
print("Select rows:")
print(ts[[1, 0]])
print("To pandas dataframe:")
print(ts.to_pd())
Length of ts: 3
Length of ts: 3
Metrics: ['Consumption', 'Wind', 'Solar']
Time-series shape: (3, 3)
Select rows:
            Consumption     Wind   Solar
2017-12-28   1299.86398  506.424  14.162
2017-12-27   1263.94091  394.507  16.530
To pandas dataframe:
            Consumption     Wind   Solar
2017-12-27   1263.94091  394.507  16.530
2017-12-28   1299.86398  506.424  14.162
2017-12-29   1319.76541  610.314  15.173