Tutorial for AutoSARIMA Forecasting Model
This notebook provides an advanced example on how to use the Auto Sarima forecasting model.
AutoSARIMA runs in 3 settings: 1. Full AutoSARIMA with approximation 2. Full AutoSARIMA without approximation 3. Partial AutoSARIMA (Predefined AR, MA, Seasonal AR, Seasonal MA hyper-parameters)
Example codes are provided for both cases below.
Prepare dataset
[1]:
import matplotlib.pyplot as plt
import numpy as np
import pandas as pd
from scipy.stats import norm
import logging

from merlion.utils.time_series import TimeSeries
from merlion.evaluate.forecast import ForecastMetric
from merlion.models.automl.autosarima import AutoSarima, AutoSarimaConfig
from merlion.models.forecast.sarima import Sarima

from ts_datasets.forecast import M4

logging.basicConfig(level=logging.INFO)

time_series, metadata = M4("Hourly")[0]
train_data = TimeSeries.from_pd(time_series[metadata.trainval])
test_data = TimeSeries.from_pd(time_series[~metadata.trainval])

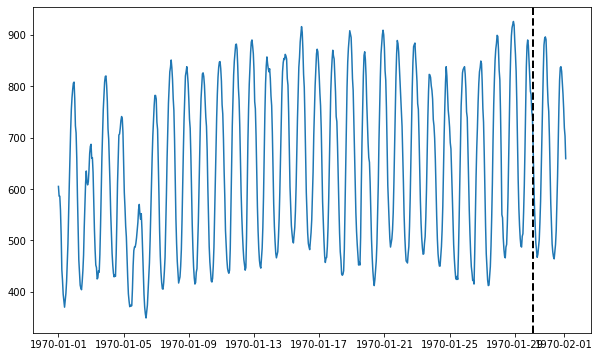
# Visualize the time series and draw a dotted line to indicate the train/test split
fig = plt.figure(figsize=(10, 6))
ax = fig.add_subplot(111)
ax.plot(time_series)
ax.axvline(metadata[metadata.trainval].index[-1], ls="--", lw="2", c="k")
plt.show()

# Print the length of training data and test data
print(f"{len(train_data)} points in train split, "
      f"{len(test_data)} points in test split.")
100%|██████████| 414/414 [00:00<00:00, 799.18it/s]

700 points in train split, 48 points in test split.
Train a full AutoSarima model with approximation (suggested, default)
[2]:
# Specify the configuration of AutoSarima with approximation
# By default, approximation is only used if the time series is long enough
#
# p, q, P, Q refer to the AR, MA, seasonal AR, and seasonal MA params, so
# auto_pqPQ=True (default) means select them automatically
#
# d is the difference order, and D is the seasonal difference order, so
# auto_d=True (default) and auto_D=True (default) means select them automatically
#
# auto_seasonality=True (default) means to automatically select the seasonality
config1 = AutoSarimaConfig(auto_pqPQ=True, auto_d=True, auto_D=True, auto_seasonality=True,
                           approximation=True, maxiter=5)
model1  = AutoSarima(config1)

# Model training
train_pred, train_err = model1.train(train_data)
INFO:merlion.models.automl.seasonality:Automatically detect the periodicity is [24]
INFO:merlion.models.automl.autosarima:Seasonal difference order is 1
INFO:merlion.models.automl.autosarima:Difference order is 0
INFO:merlion.models.automl.autosarima:Fitting models using approximations(approx_iter is 1) to speed things up
INFO:merlion.models.automl.autosarima:Best model:  SARIMA(2,0,2)(0,1,1)[24] without constant
[3]:
# Model forecasting
forecast1, stderr1 = model1.forecast(len(test_data))

# Model evaluation
smape1 = ForecastMetric.sMAPE.value(ground_truth=test_data, predict=forecast1)
print(f"Full AutoSarima with approximation sMAPE is {smape1:.4f}")
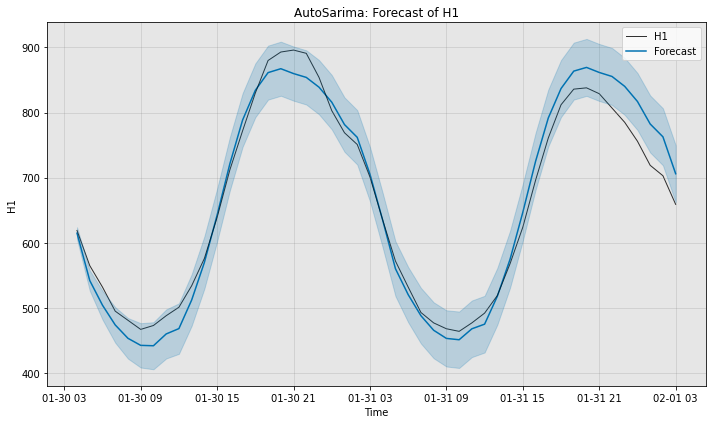
Full AutoSarima with approximation sMAPE is 3.4491
[4]:
# Visualize the groud truth, actual forecast and confidence interval
fig, ax = model1.plot_forecast(time_series=test_data, plot_forecast_uncertainty=True)
plt.show()

Train a full AutoSarima model without approximation (slower)
[5]:
# Specify the configuration of full AutoSarima without approximation
# Note that the default values of all the auto_* parameters are True
config2 = AutoSarimaConfig(approximation=False, maxiter=5)
model2  = AutoSarima(config2)

# Model training
train_pred, train_err = model2.train(train_data)
INFO:merlion.models.automl.seasonality:Automatically detect the periodicity is [24]
INFO:merlion.models.automl.autosarima:Seasonal difference order is 1
INFO:merlion.models.automl.autosarima:Difference order is 0
INFO:merlion.models.automl.autosarima:Best model:  SARIMA(2,0,3)(1,1,1)[24] without constant
[6]:
# Model forecasting
forecast2, stderr2 = model2.forecast(len(test_data))

# Model evaluation
smape2 = ForecastMetric.sMAPE.value(ground_truth=test_data, predict=forecast2)
print(f"Full AutoSarima without approximation sMAPE is {smape2:.4f}")
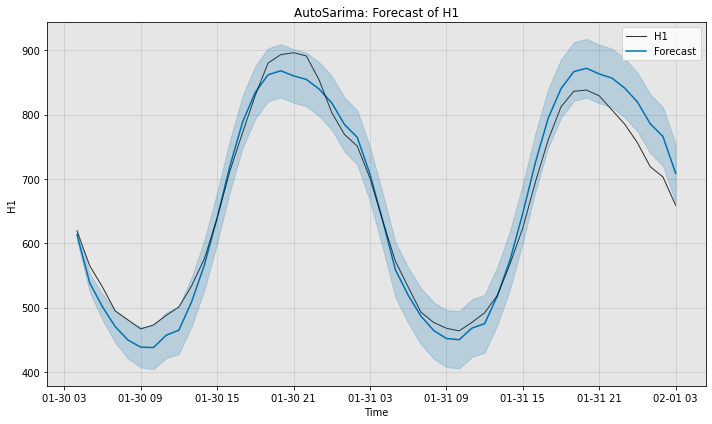
Full AutoSarima without approximation sMAPE is 3.6991
[7]:
# Visualize the groud truth, actual forecast and confidence interval
fig, ax = model2.plot_forecast(time_series=test_data, plot_forecast_uncertainty=True)
plt.show()

Train a partial autosarima model
Here, the user has pre-defined the AR, MA, Seasonal AR, and Seasonal MA hyper-parameters.
[8]:
# Specify the configuration of partial AutoSarima
# We explicitly specify values of p, q, P, Q in the order and seasonal order,
# and we set auto_pqPQ=False.
# Because auto_d=True, auto_D=True, and auto_seasonality=True by default, we
# can specify arbitrary values for them in the order and seasonal order (e.g. "auto")
config3 = AutoSarimaConfig(auto_pqPQ=False, order=(15, "auto", 5),
                           seasonal_order=(2, "auto", 1, "auto"), maxiter=5)
model3  = AutoSarima(config3)

# Model training
train_pred, train_err = model3.train(
    train_data, train_config={"enforce_stationarity": True,"enforce_invertibility": True})
INFO:merlion.models.automl.seasonality:Automatically detect the periodicity is [24]
INFO:merlion.models.automl.autosarima:Seasonal difference order is 1
INFO:merlion.models.automl.autosarima:Difference order is 0
[9]:
# Model forecasting
forecast3, stderr3 = model3.forecast(len(test_data))

# Model evaluation
smape3 = ForecastMetric.sMAPE.value(ground_truth=test_data, predict=forecast3)
print(f"Partial AutoSarima without approximation sMAPE is {smape3:.4f}")
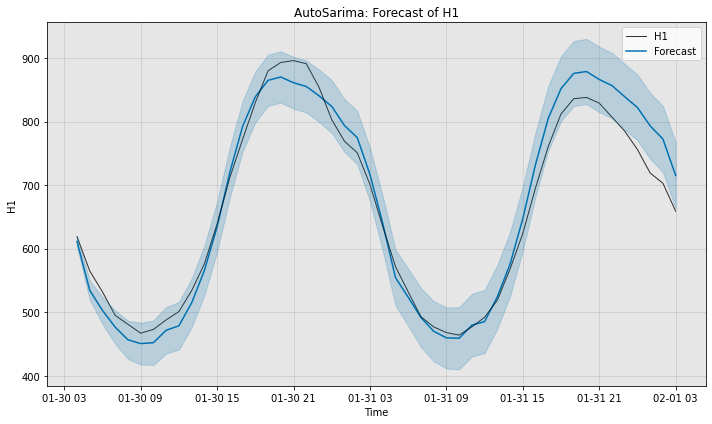
Partial AutoSarima without approximation sMAPE is 3.5288
[10]:
# Visualize the groud truth, actual forecast and confidence interval
fig, ax = model3.plot_forecast(time_series=test_data, plot_forecast_uncertainty=True)
plt.show()
