Explore LogAI GUI Portal
You can also start a local LogAI service and use the GUI portal to explore LogAI.
export PYTHONPATH='.'  # make sure to add current root to PYTHONPATH
python3 gui/application.py # Run local plotly dash server.
Then open the LogAI portal via http://localhost:8050/ or http://127.0.0.1:8050/ in your browser:
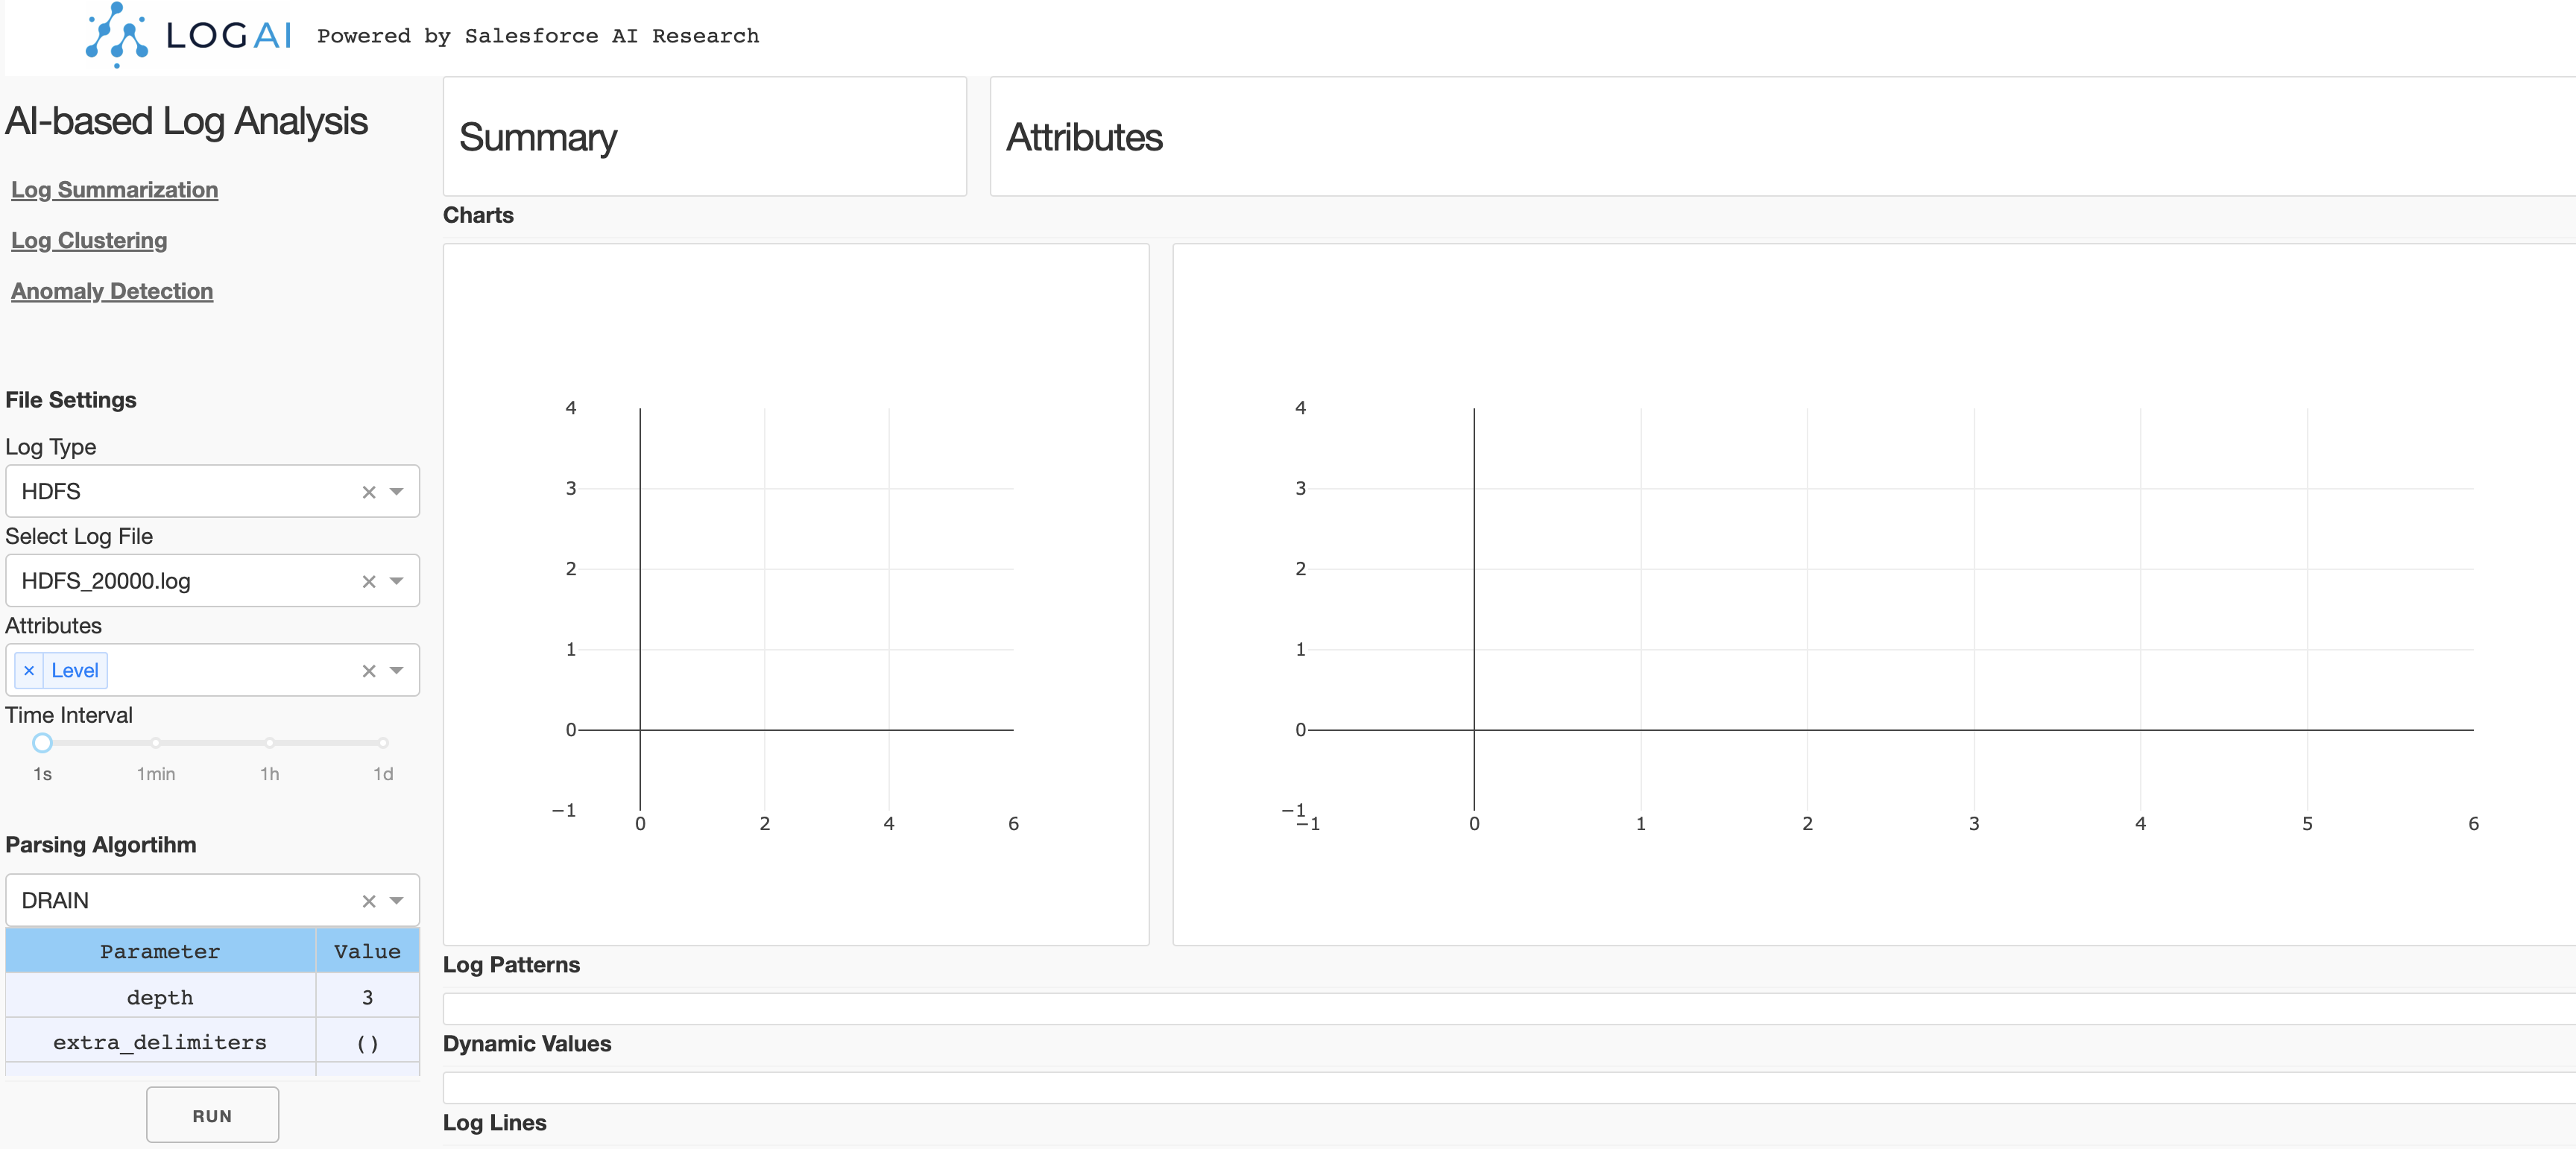
The control panel is on the left side of the page. There are three applications you can choose from: Log Summarization, Log Clustering and Anomaly Detection.
Control Panel
File Setting. You can select the log type and log files to be processed. Now LogAI supports three public datasets: HDFS, BGL and HealthApp. For each log type we included several sample log data. After log file selected, you can choose the attributes you want to be involved in log processing. The selected attributes will be treated as structured log attributes.
Algorithm Setting. For different applications, the algorithms options may be different.
For example, auto-log parsing algorithms are utilized for log summarization, but log clustering uses
auto-parsing algorithms, vectorization algorithms, categorical encoding and clustering algorithms. You can select a
algorithm and change the parameters in each algorithm section. After algorithm configuration, simply click run to
run the application.
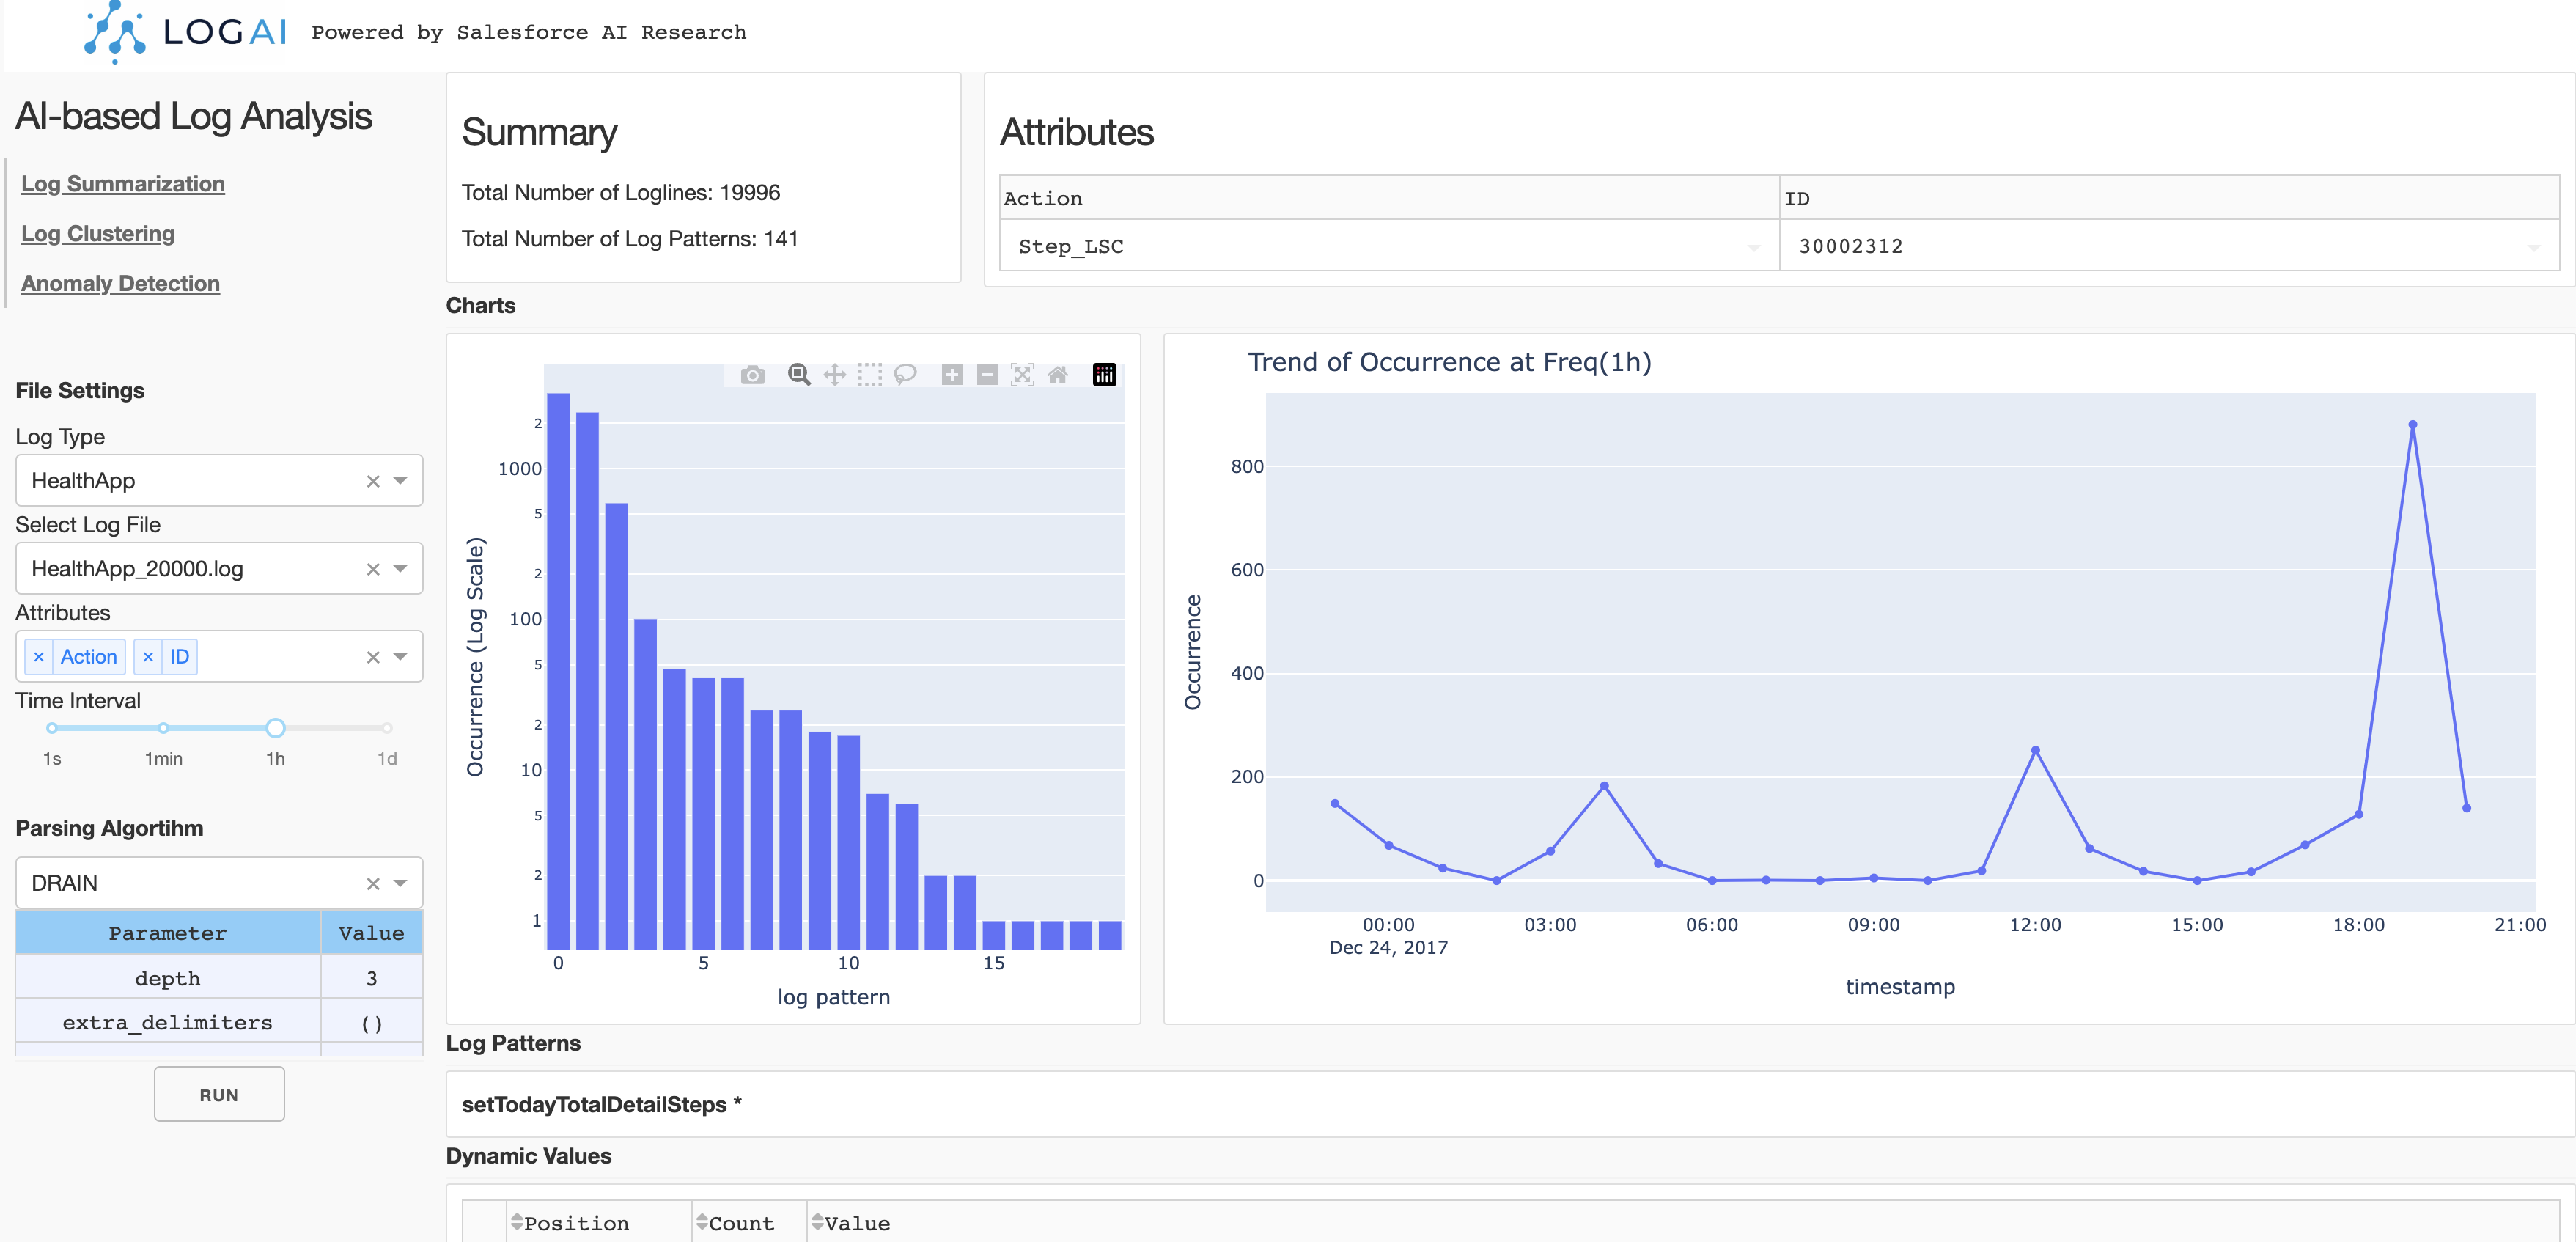
Log Summarization
Log summarization App summarize and group the raw logs by log patterns and attributes. You can click on each log pattern and see what the pattern looks like and the dynamic values in each position. You can also see the chart of occurrance trend of this pattern on the right side.
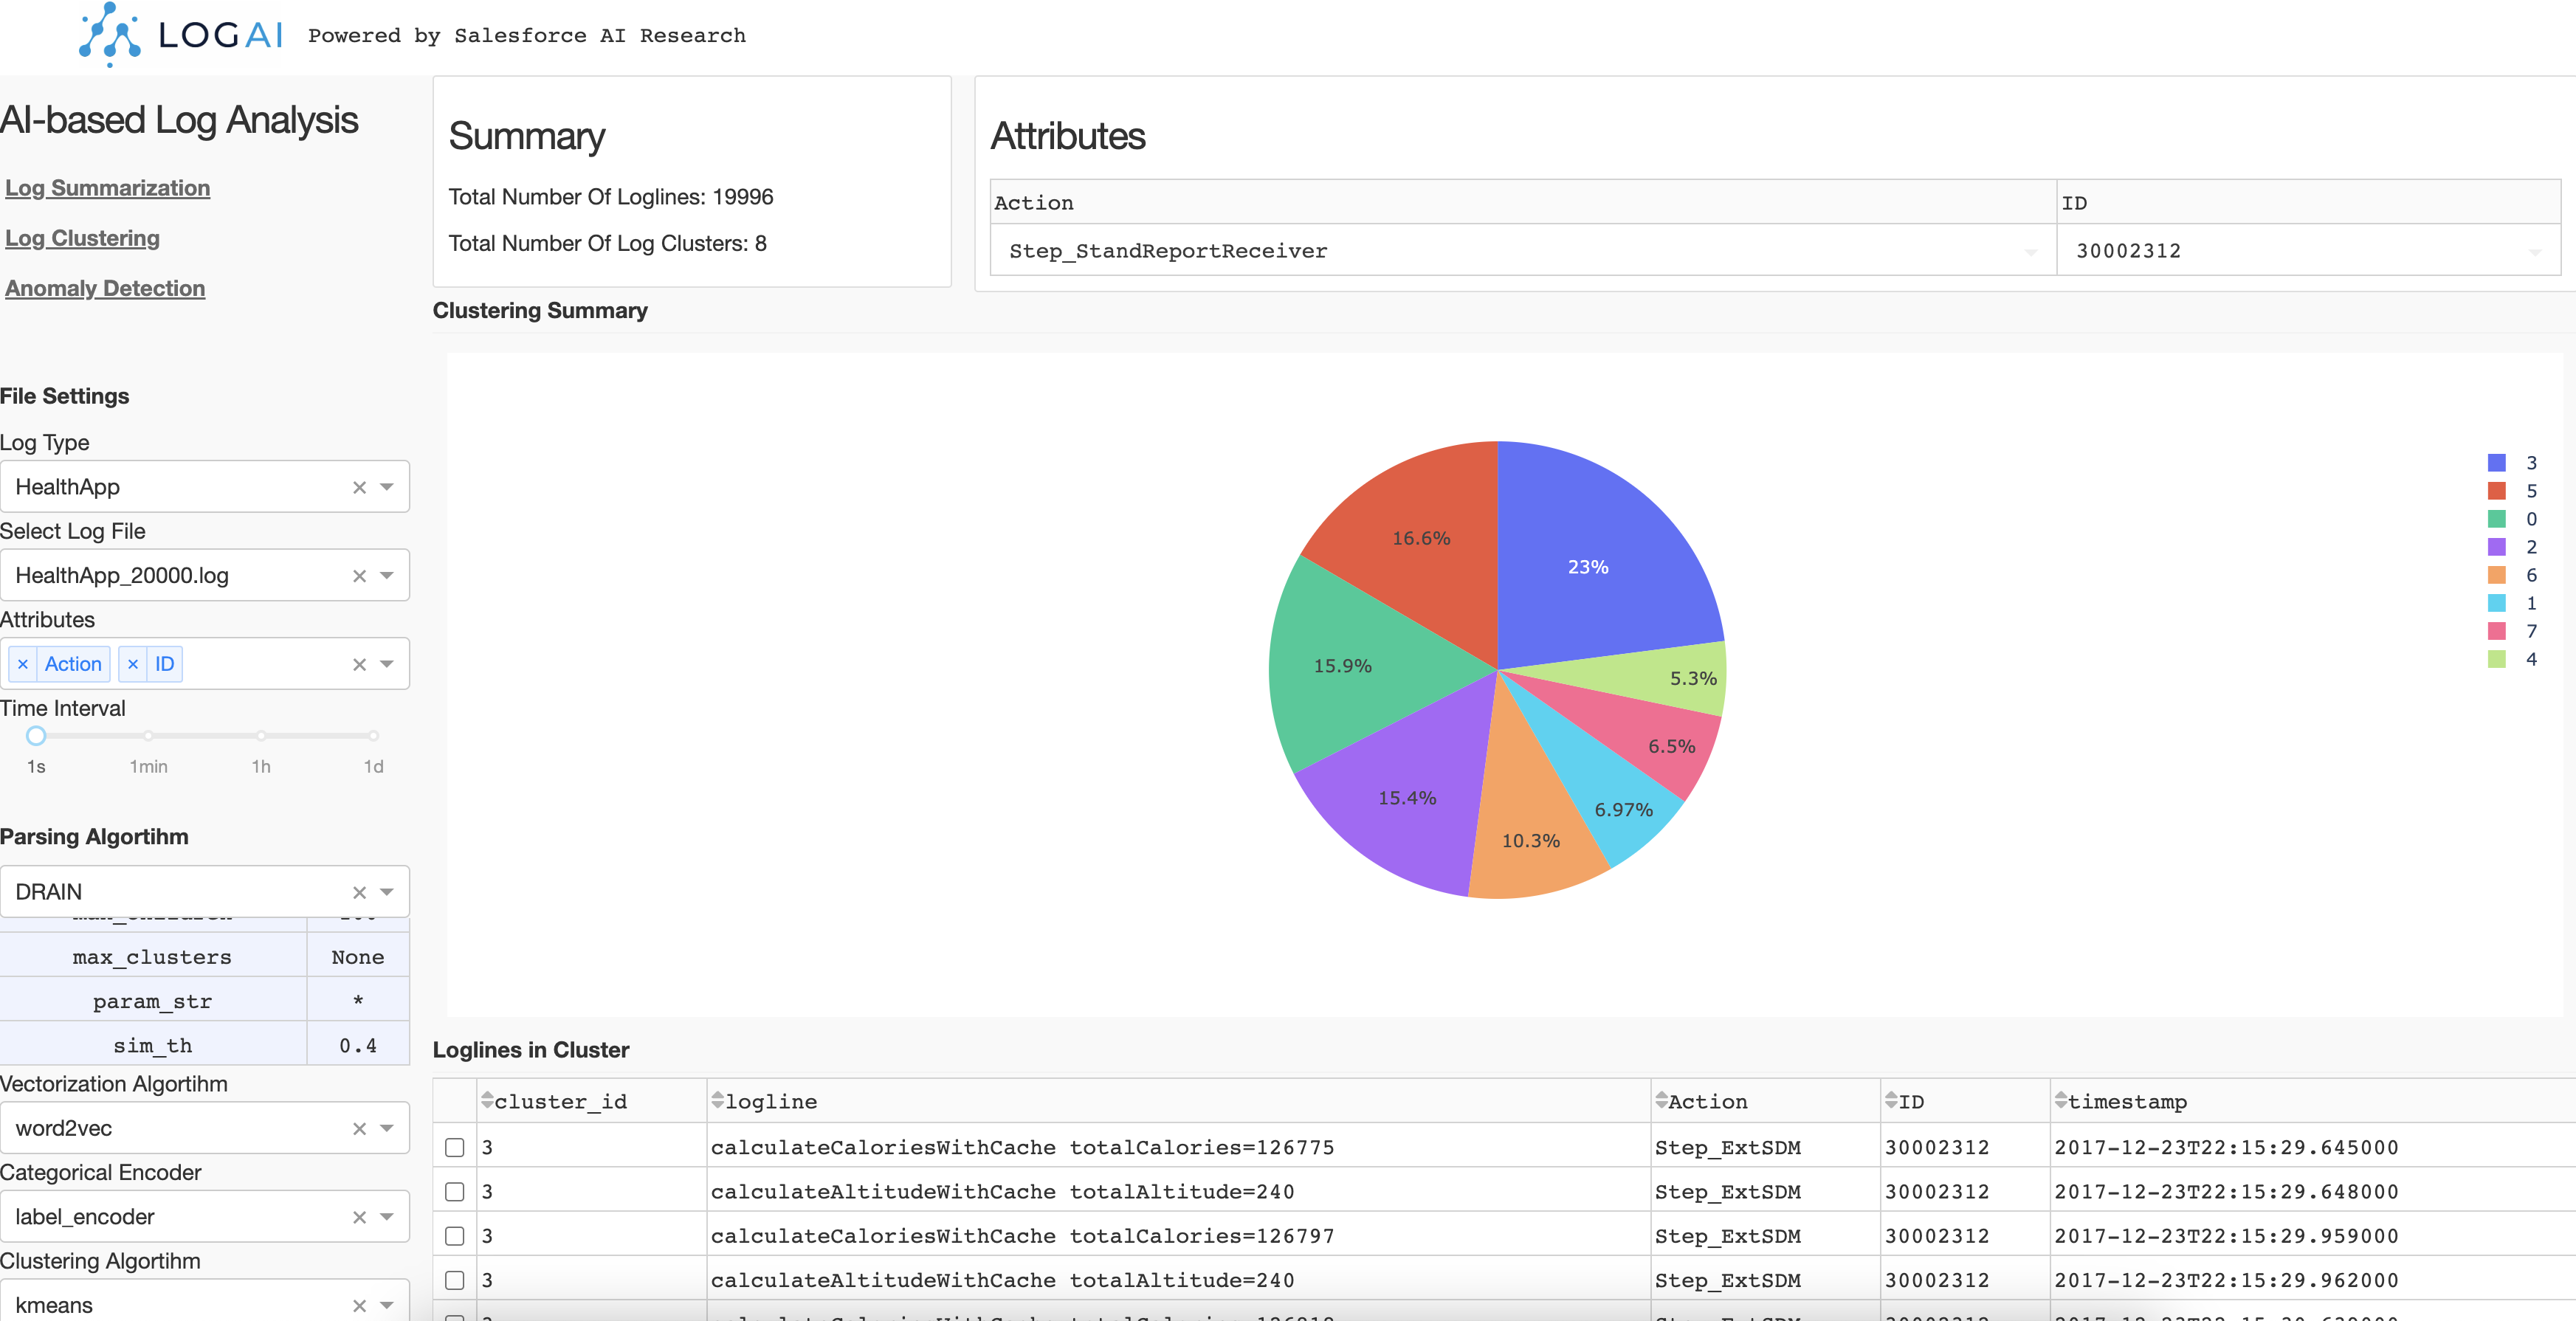
Log Clustering
Log clustering App groups raw logs into clusters by calculating the semantic representation of each logline. Then using clustering algorithms to generate log clusters. In this example, we choose k-mean where k==8 to generate 8 clusters. The result is shown as a pie chart and you can click each portion of the pie chart to check the raw logs in this cluster.
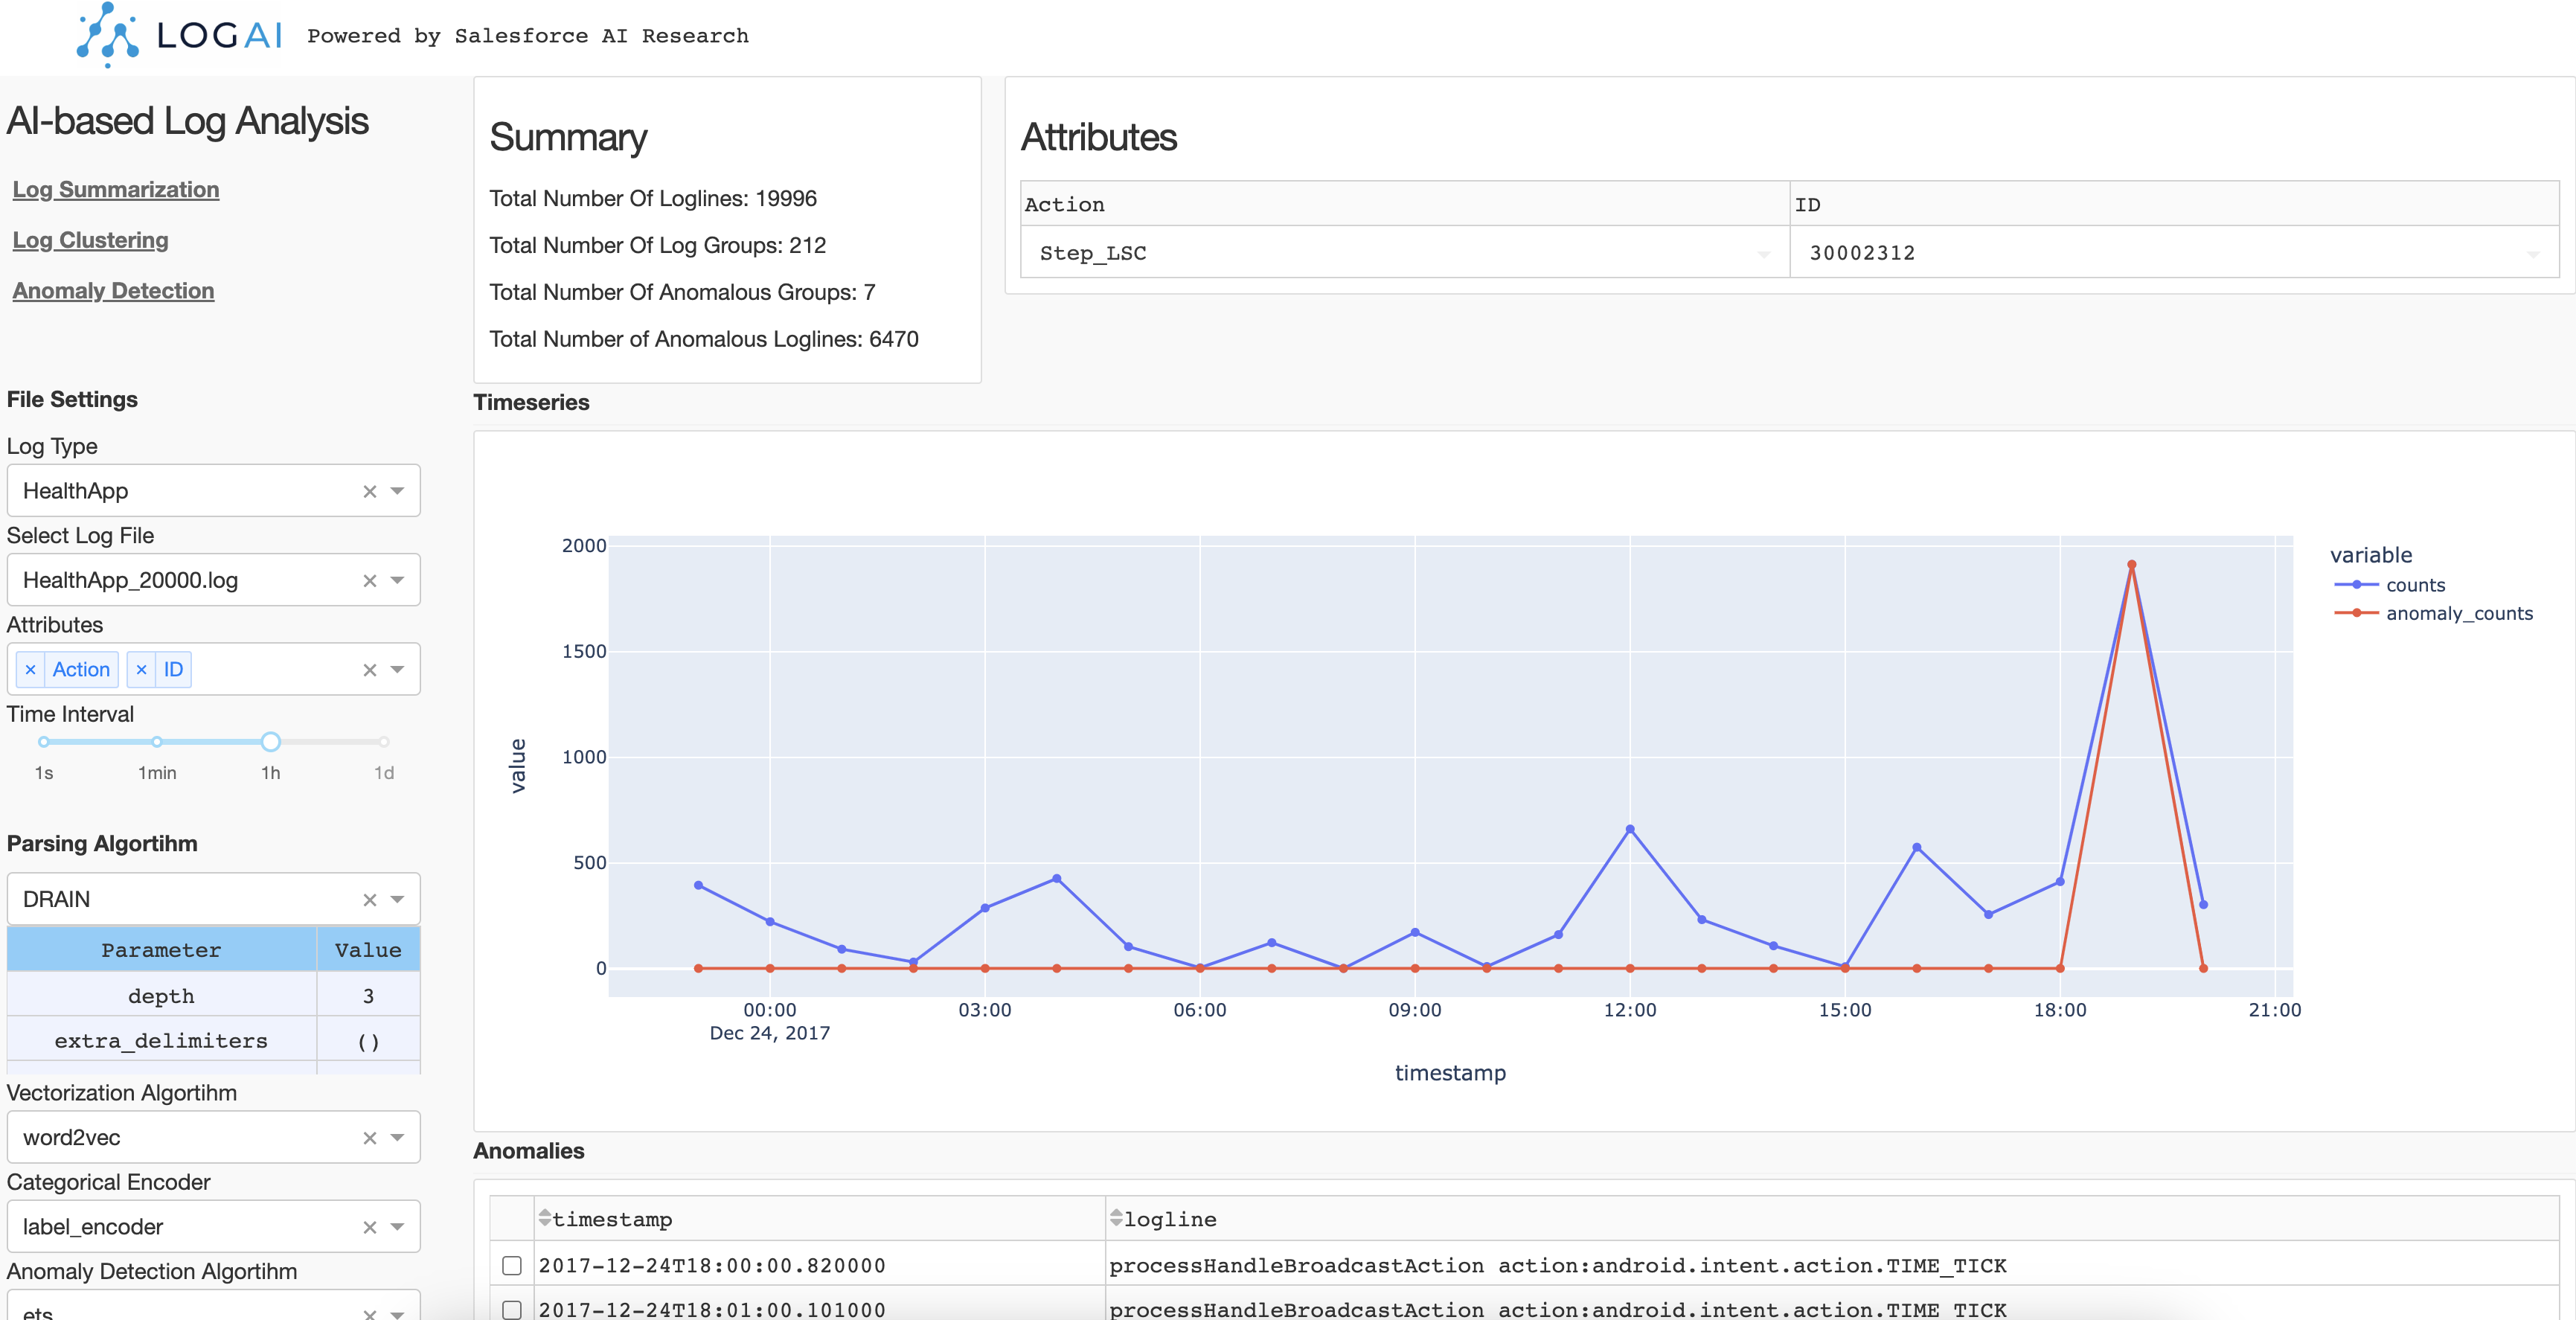
Anomaly Detection
Log anomaly detection App conduct log anomaly detection tasks. Similar to log clustering, log anomaly detection also needs to extract information from raw logs and generate reprentation of loglines. Depend on the type of anomaly detection, The representation can be different. Time-series anomaly detection. If we use time-series algorithm like ETS, the raw logs will be converted into log counter vectors by given time interval. Then ETS is performed on the generated log counter vectors and detect anomalous timestamps on the counter vector time-series.
Semantic anomaly detection. If we use unsupervised outlier detection algorithms such as One-class SVM, the raw logs will be converted into semantic vectors and feed the One-class SVM model. Then the model will detect anomalous loglines.
LogAI GUI portal is just an example to demo LogAI capabilities. We know this may not be the best way to visualize the results and there might be bugs in how the results are displayed. We will keep working with the open source community to improve usability of the portal. Any feedbacks and contributions are welcome :blush:.