pyrca.tools package
To launch the app for data analysis and causal discovery, you can run python -m pyrca.tools:
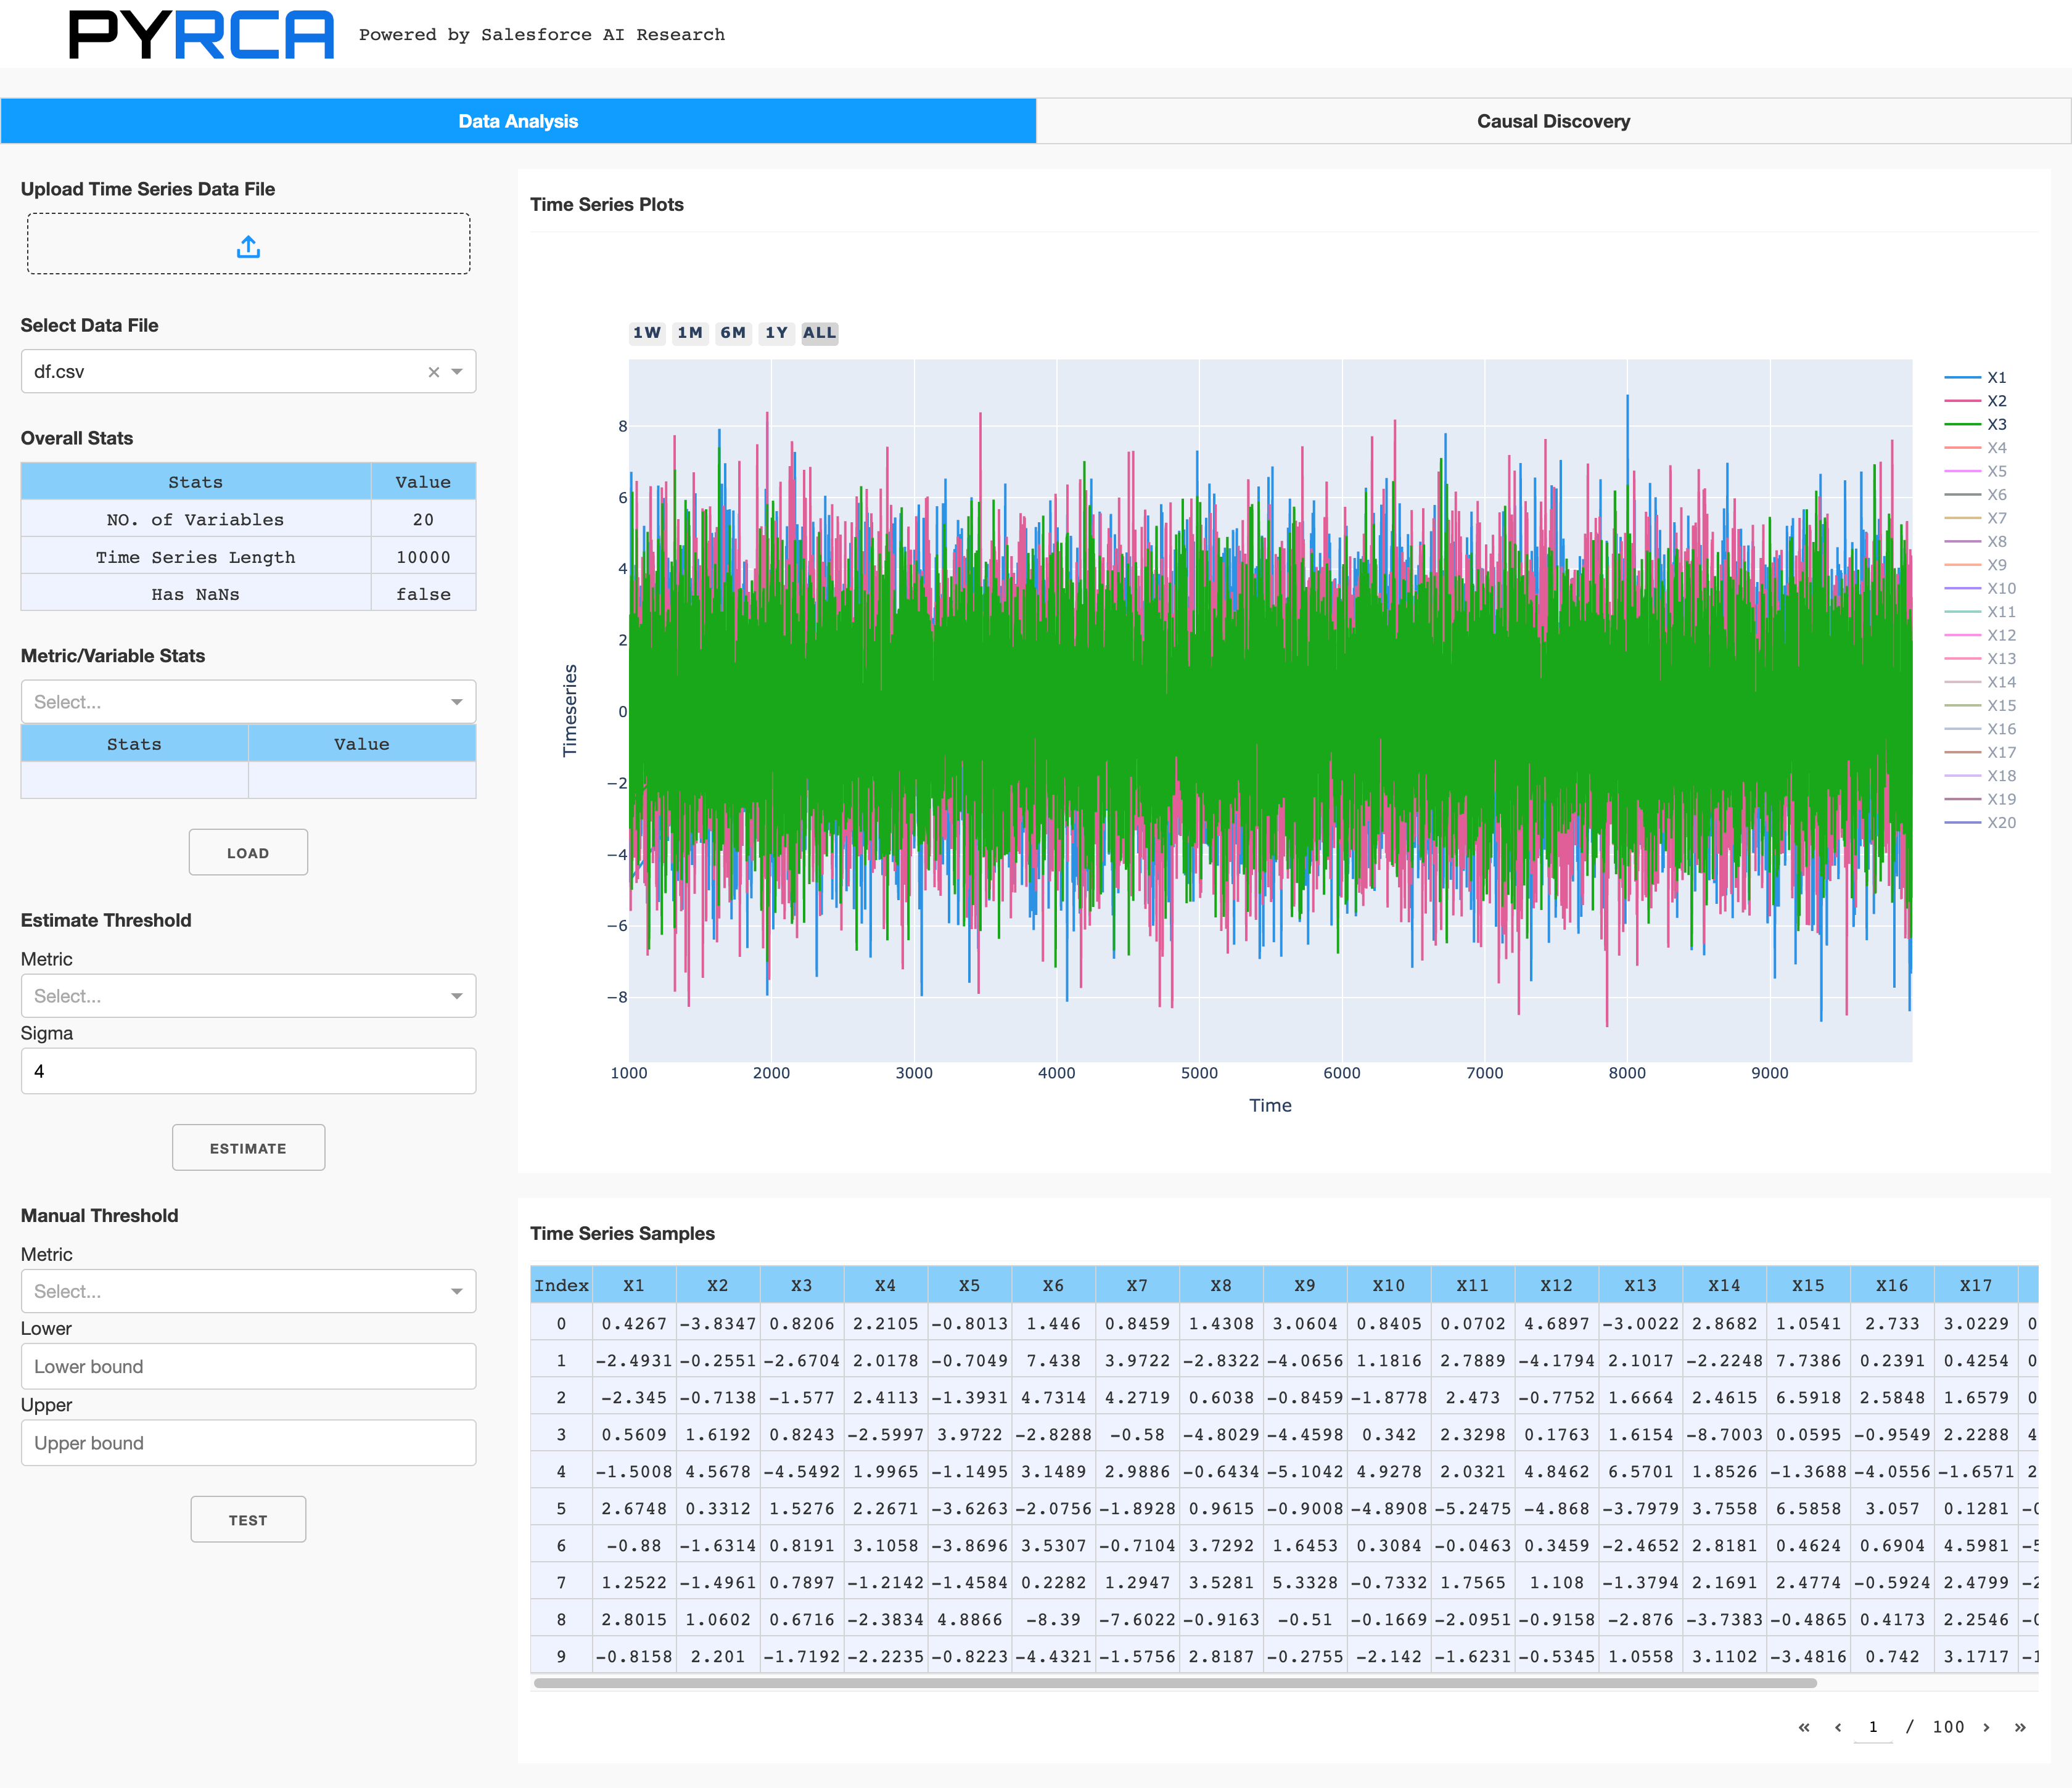
The “Data Analysis” tab allows you to upload your time series data, visualize all the metrics,
check some basic stats such as means and variances, and tune the hyperparameters for stats-threshold
based anomaly detectors. PyRCA supports a basic stats-based anomaly detector
pyrca.outliers.stats that you can apply for detecting anomalous spikes in the data. If this
anomaly detector is not suitable for your use cases, you can also try Merlion for other anomaly detectors.
Note that the time series data should be in a CSV format, where the first column is
the timestamp and the other columns are the metrics.
The “Causal Discovery” tab is used to build causal graphs estimated from time series data.
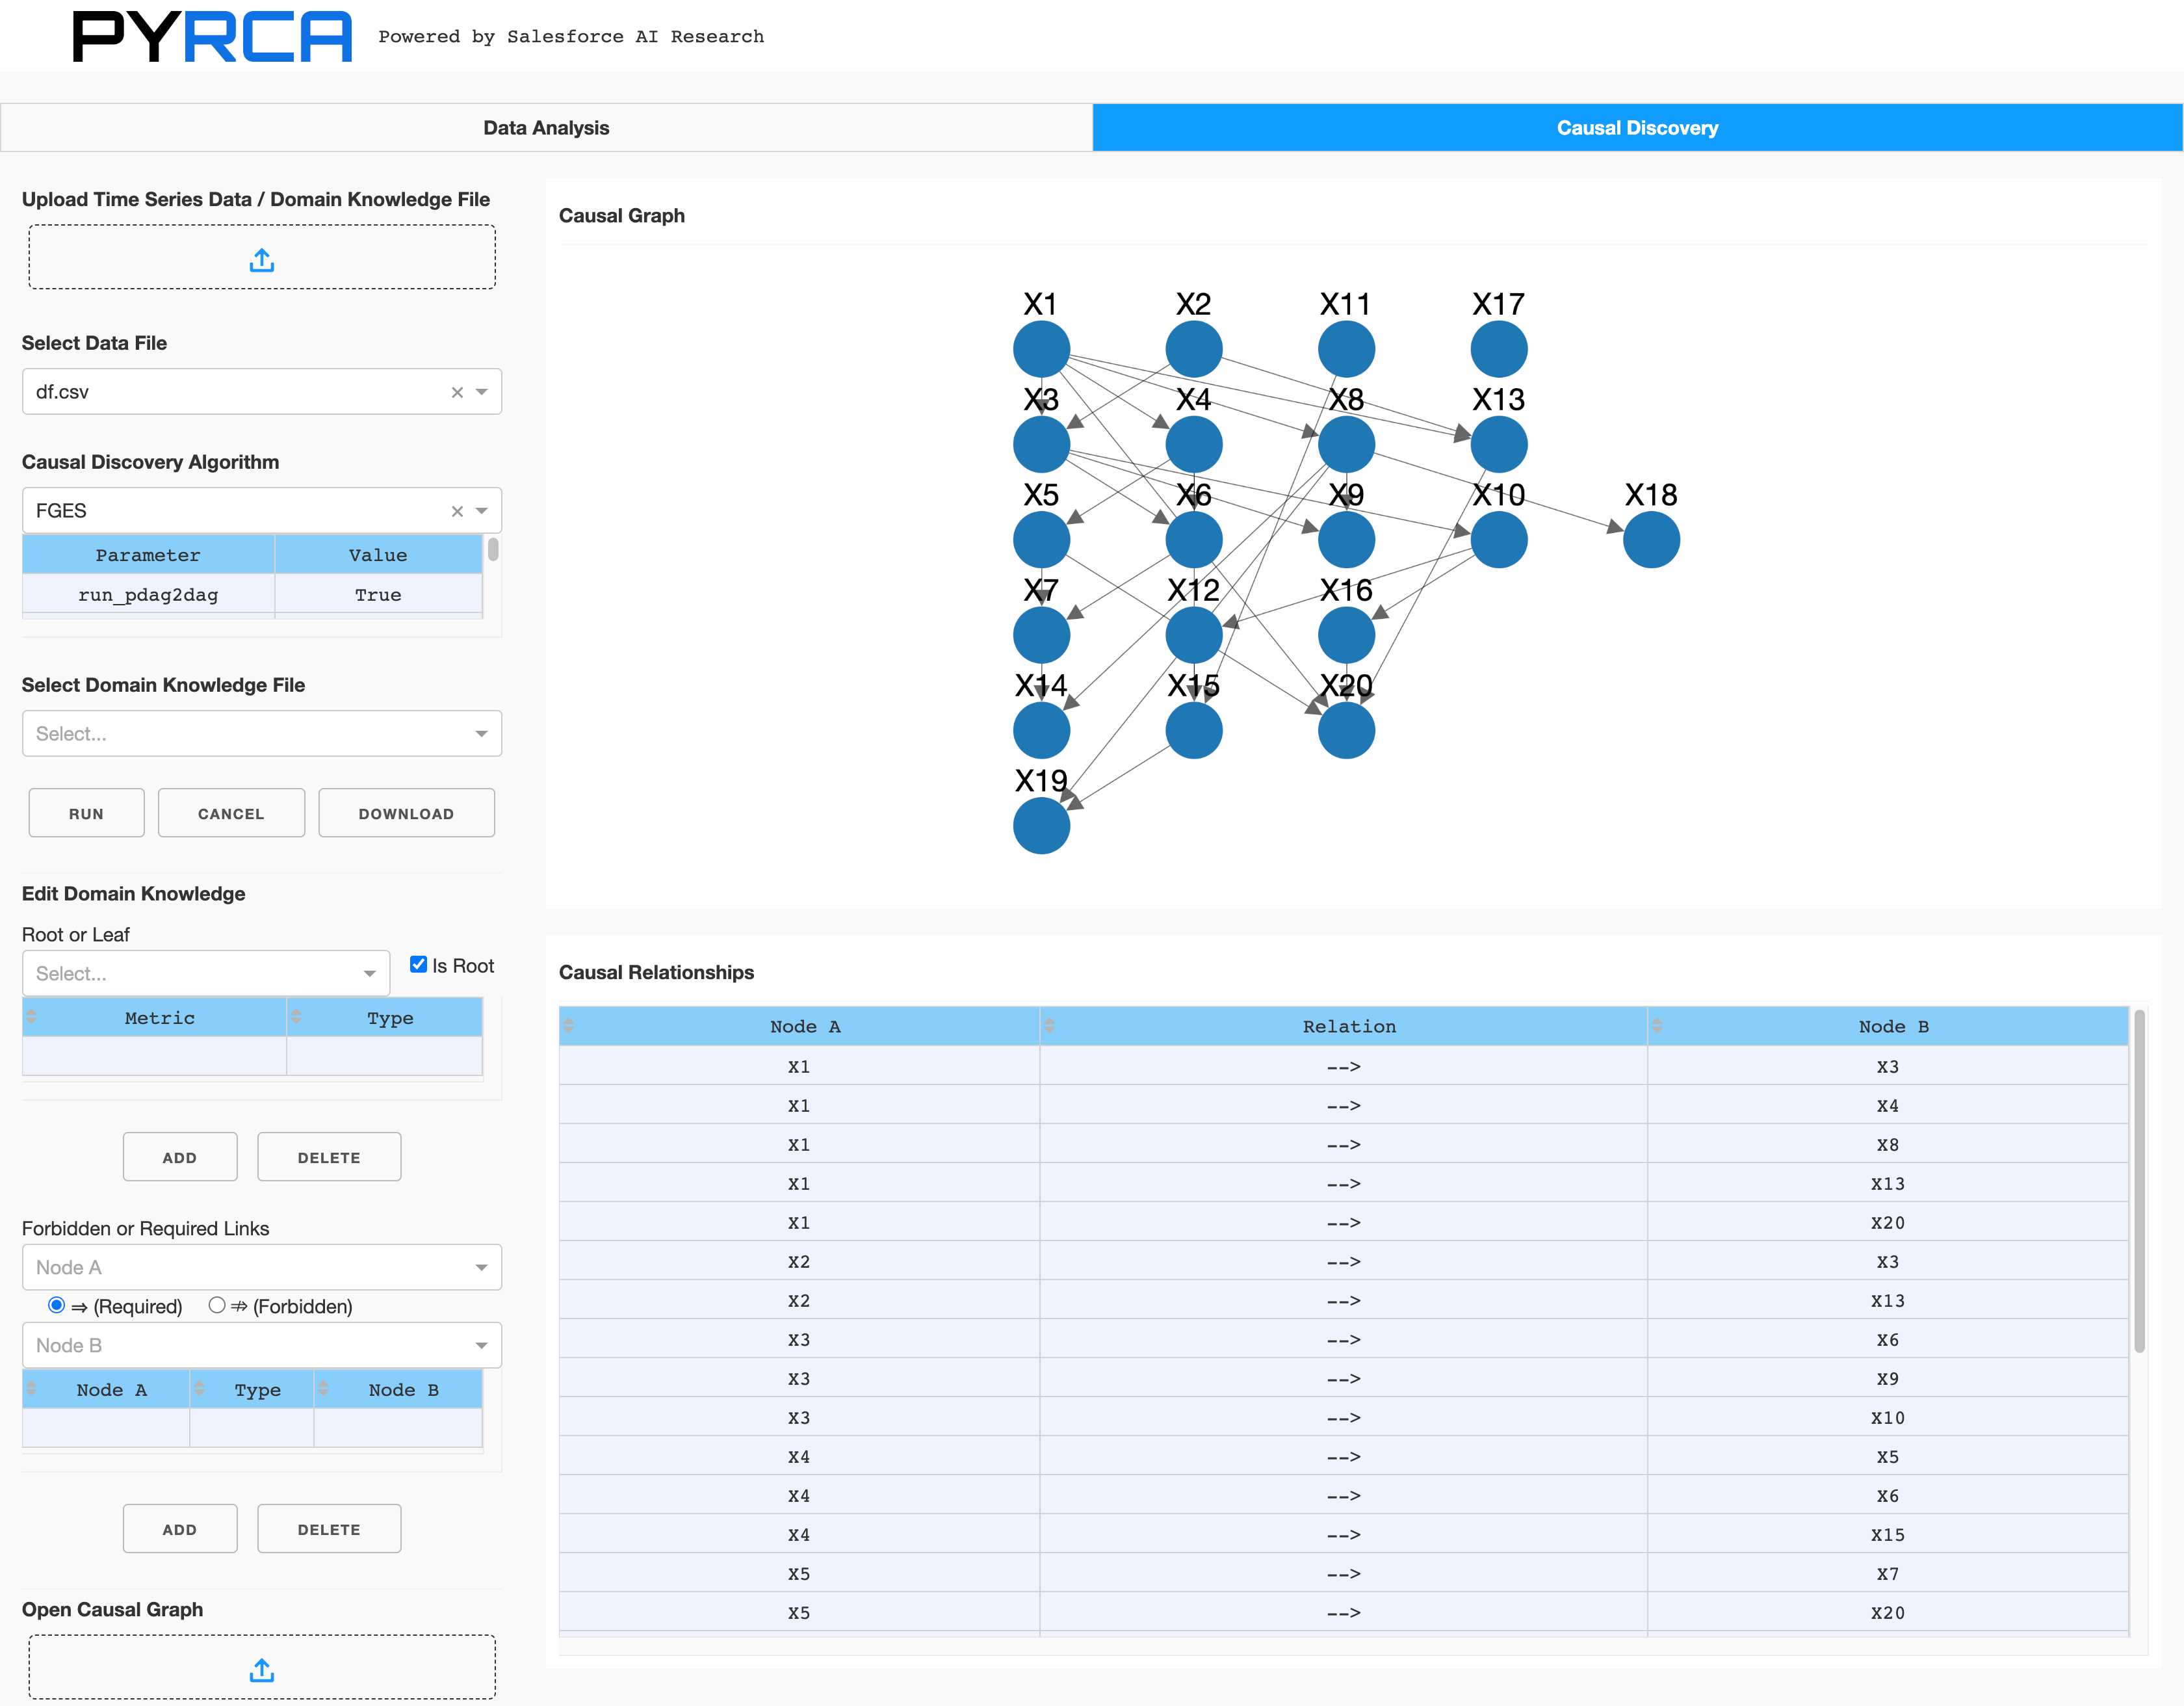
To build a causal graph, you can follow the steps below:
Upload the time series data, and the domain knowledge file (optional, in the YAML format).
Choose the uploaded time series data you want to use for building the graph that describes the causal relationships between different metrics.
Select a causal discovery method, e.g., PC or FGES, and adjust the corresponding parameters if necessary. For example, you may change “max_degree” and “penalty_discount” for FGES.
Select the uploaded domain knowledge file if there exists.
Click the “Run” button to generate the first version of the causal graph. The figure on the right hand side will show the causal graph, where you can manually check if there are missing links or incorrect links.
If the generated causal graph has errors, you can add additional constraints, e.g., root/leaf nodes, required/forbidden links, in the “Edit Domain Knowledge” card.
After the new constraints are added, you click the “Run” button again to refine the causal graph.
If you satisfy with the generated causal graph, you can click the “Download” button to save it on the local disk. You then can use it to build your RCA solution.
In real-world applications, causal discovery methods usually cannot generate accurate causal graphs due to data issues. This app provides a convenient UI for you to interactively edit and revise causal graphs.